U.S. Consumers Hold More Cash but Make Fewer Payments
Chair, CashEssentials
This post is also available in:
![]()
The 2021 Diary of Consumer Payment Choice, carried out in October 2020, shows that consumer paymentA transfer of funds which discharges an obligation on the part of a payer vis-à-vis a payee. More behaviour changed dramatically during the pandemic. Total payments, cashMoney in physical form such as banknotes and coins. More, and non-cash declined by 20%, mostly due to the drop in low-value transactions (under $25). This disproportionately affects cash which historically accounted for the majority of small payments.
The key high-level findings are:
- U.S. consumers made an average of 34 payments in October 2020, down from 39 in 2019
- Cash use accounted for 19% of all payments, down seven percentage points from 2019
- Small-value payments, defined as transactions under $25, declined by 26%
- Total value spent increased from $4,236 to $4,760
- The average value of cash held in consumers’ pocket, purse, or wallet increased to $74, up to $20 from 2019
- Approximately 72 percent of U.S. consumers reported making an in-person payment over their three-day reporting period, down from 91 percent in 2019
- Total spending on not-in-person, non-bill payments increased substantially at grocery stores, dining establishments, and general merchandise locations.
Fewer Payments and Higher Average Transaction Value
In October 2020, U.S. consumers made 34 payments per month, down from 39 payments in 2019. However, monthly spending increased to an average of $4,760 in 2020, up from $4,236 in 2019. This suggests consumers aggregated their purchases into fewer transactions, combining transactions for multiple products at one store or on one platform. In addition, the number of remote payments grew from 13% of all transactions in 2019 to 20% in 2020. A previous May 2020 survey showed that 63% of consumers did not make a single in-person payment between March and May 2020.
As a result, the share of cash in the payments mix decreased by seven percentage points in 2020, from 26% to 19%, a larger decline than experienced in any category over the past two years (see Graph 1).
Graph 1. United States: Share of Payment InstrumentDevice, tool, procedure or system used to make a transaction or settle a debt. More Use by Year, 2018-2020.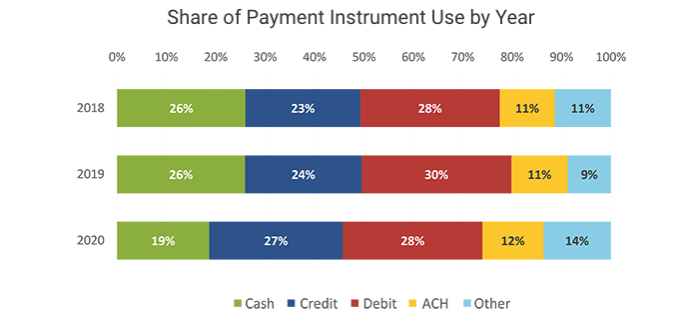 Source: Federal Reserve BankSee Central bank. More of San Francisco
Increased Cash Holdings During the Pandemic
The diary also shows their consumers increased their on-person – i.e., in their pocket, a purse, or wallet – holdings of cash from approximately $55 before the pandemic to $74 in 2020. The increase occurred for all adult age groups and household income levels (see Graph 2). For example, individuals between the ages of 18 to 24, who previously held the least amount of cash on hand, almost doubled their daily holdings, from $33 to $60, since the start of the pandemic. In a separate survey carried out in May 2020, the Federal Reserve concluded that the value of cash stored elsewhere – i.e., not on their person – was far greater for all groups than pre-pandemic amounts. On average, cash stored elsewhere nearly doubled, rising from $257 to $483.
Graph 2. United States: Average Daily Holdings by Age, 2016-2020.
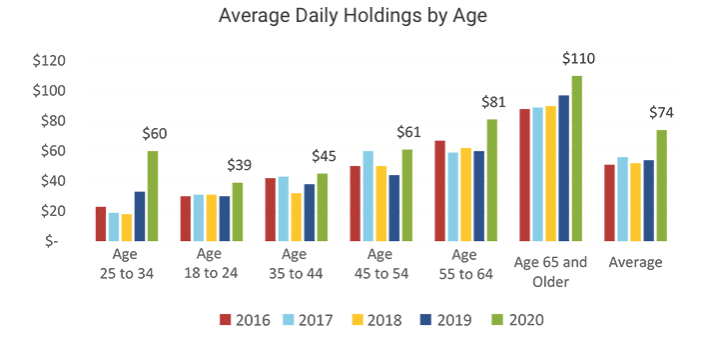
Source: Federal Reserve Bank of San Francisco.
In conclusion, the report raises the question of whether the changeThis is the action by which certain banknotes and/or coins are exchanged for the same amount in banknotes/coins of a different face value, or unit value. See Exchange. More in payment behaviour observed during the pandemic is permanent or temporary. Will consumers stick with digital payments, or will they switch back to cash for their low-value in-person payments as the US economy re-opens? It is still too early to say, but one early signal is the evolution of cash in circulationThe value (or number of units) of the banknotes and coins in circulation within an economy. Cash in circulation is included in the M1 monetary aggregate and comprises only the banknotes and coins in circulation outside the Monetary Financial Institutions (MFI), as stated in the consolidated balance sheet of the MFIs, which means that the cash issued and held by the MFIs has been subtracted (“cash reserves”). Cash in circulation does not include the balance of the central bank’s own banknot... More in the first months of 2021. Fed data shows that growth in cash in circulation has been accelerating since mid-March, three months after the number of new Covid-19 cases started declining sharply in the country (see Graph 3).
Graph 3. United States: CurrencyThe money used in a particular country at a particular time, like dollar, yen, euro, etc., consisting of banknotes and coins, that does not require endorsement as a medium of exchange. More in circulation (weekly average), January-May 2021

Source: Federal Reserve Bank of St. Louis.
This post is also available in:
![]()