Update on the Global Demand for Banknotes
This update will start with an analysis of the development of banknoteA banknote (or ‘bill’ as it is often referred to in the US) is a type of negotiable promissory note, issued by a bank or other licensed authority, payable to the bearer on demand. More circulation in value terms during recent years, followed by that in volume terms. Besides developments during last few years also indicators since 2013 are examined. In addition, we will continue the analysis published in September the the use of coins vs. durable note substrates in replacing low-end paperSee Banknote paper. More notes. It was concluded then, that the note/coin boundary is not changing as often as in the past, because durable note substrates are increasingly used to replace low-end paper notes instead of new high-end coins. In this article the focus is shifted from the low to the high end of the currencyThe money used in a particular country at a particular time, like dollar, yen, euro, etc., consisting of banknotes and coins, that does not require endorsement as a medium of exchange. More structure and the impact of digital payments on the introduction of new high-end notes is analysed.
Banknote circulation in value terms
Using statistics and various publications available on central bank websites, a slightly varying number (between 143 and 145) of currencies have been addressed in the following chart, related to the growth rates by value of banknotes in circulation in years 2021−2024. The figures refer to the end of the calendar year, even in cases where the financial year of the respective central bank is not the calendar year. However, in the case of three currencies the figures refer to an earlier month of the year because the corresponding central banks haven’t yet published the figures at the end of 2024.
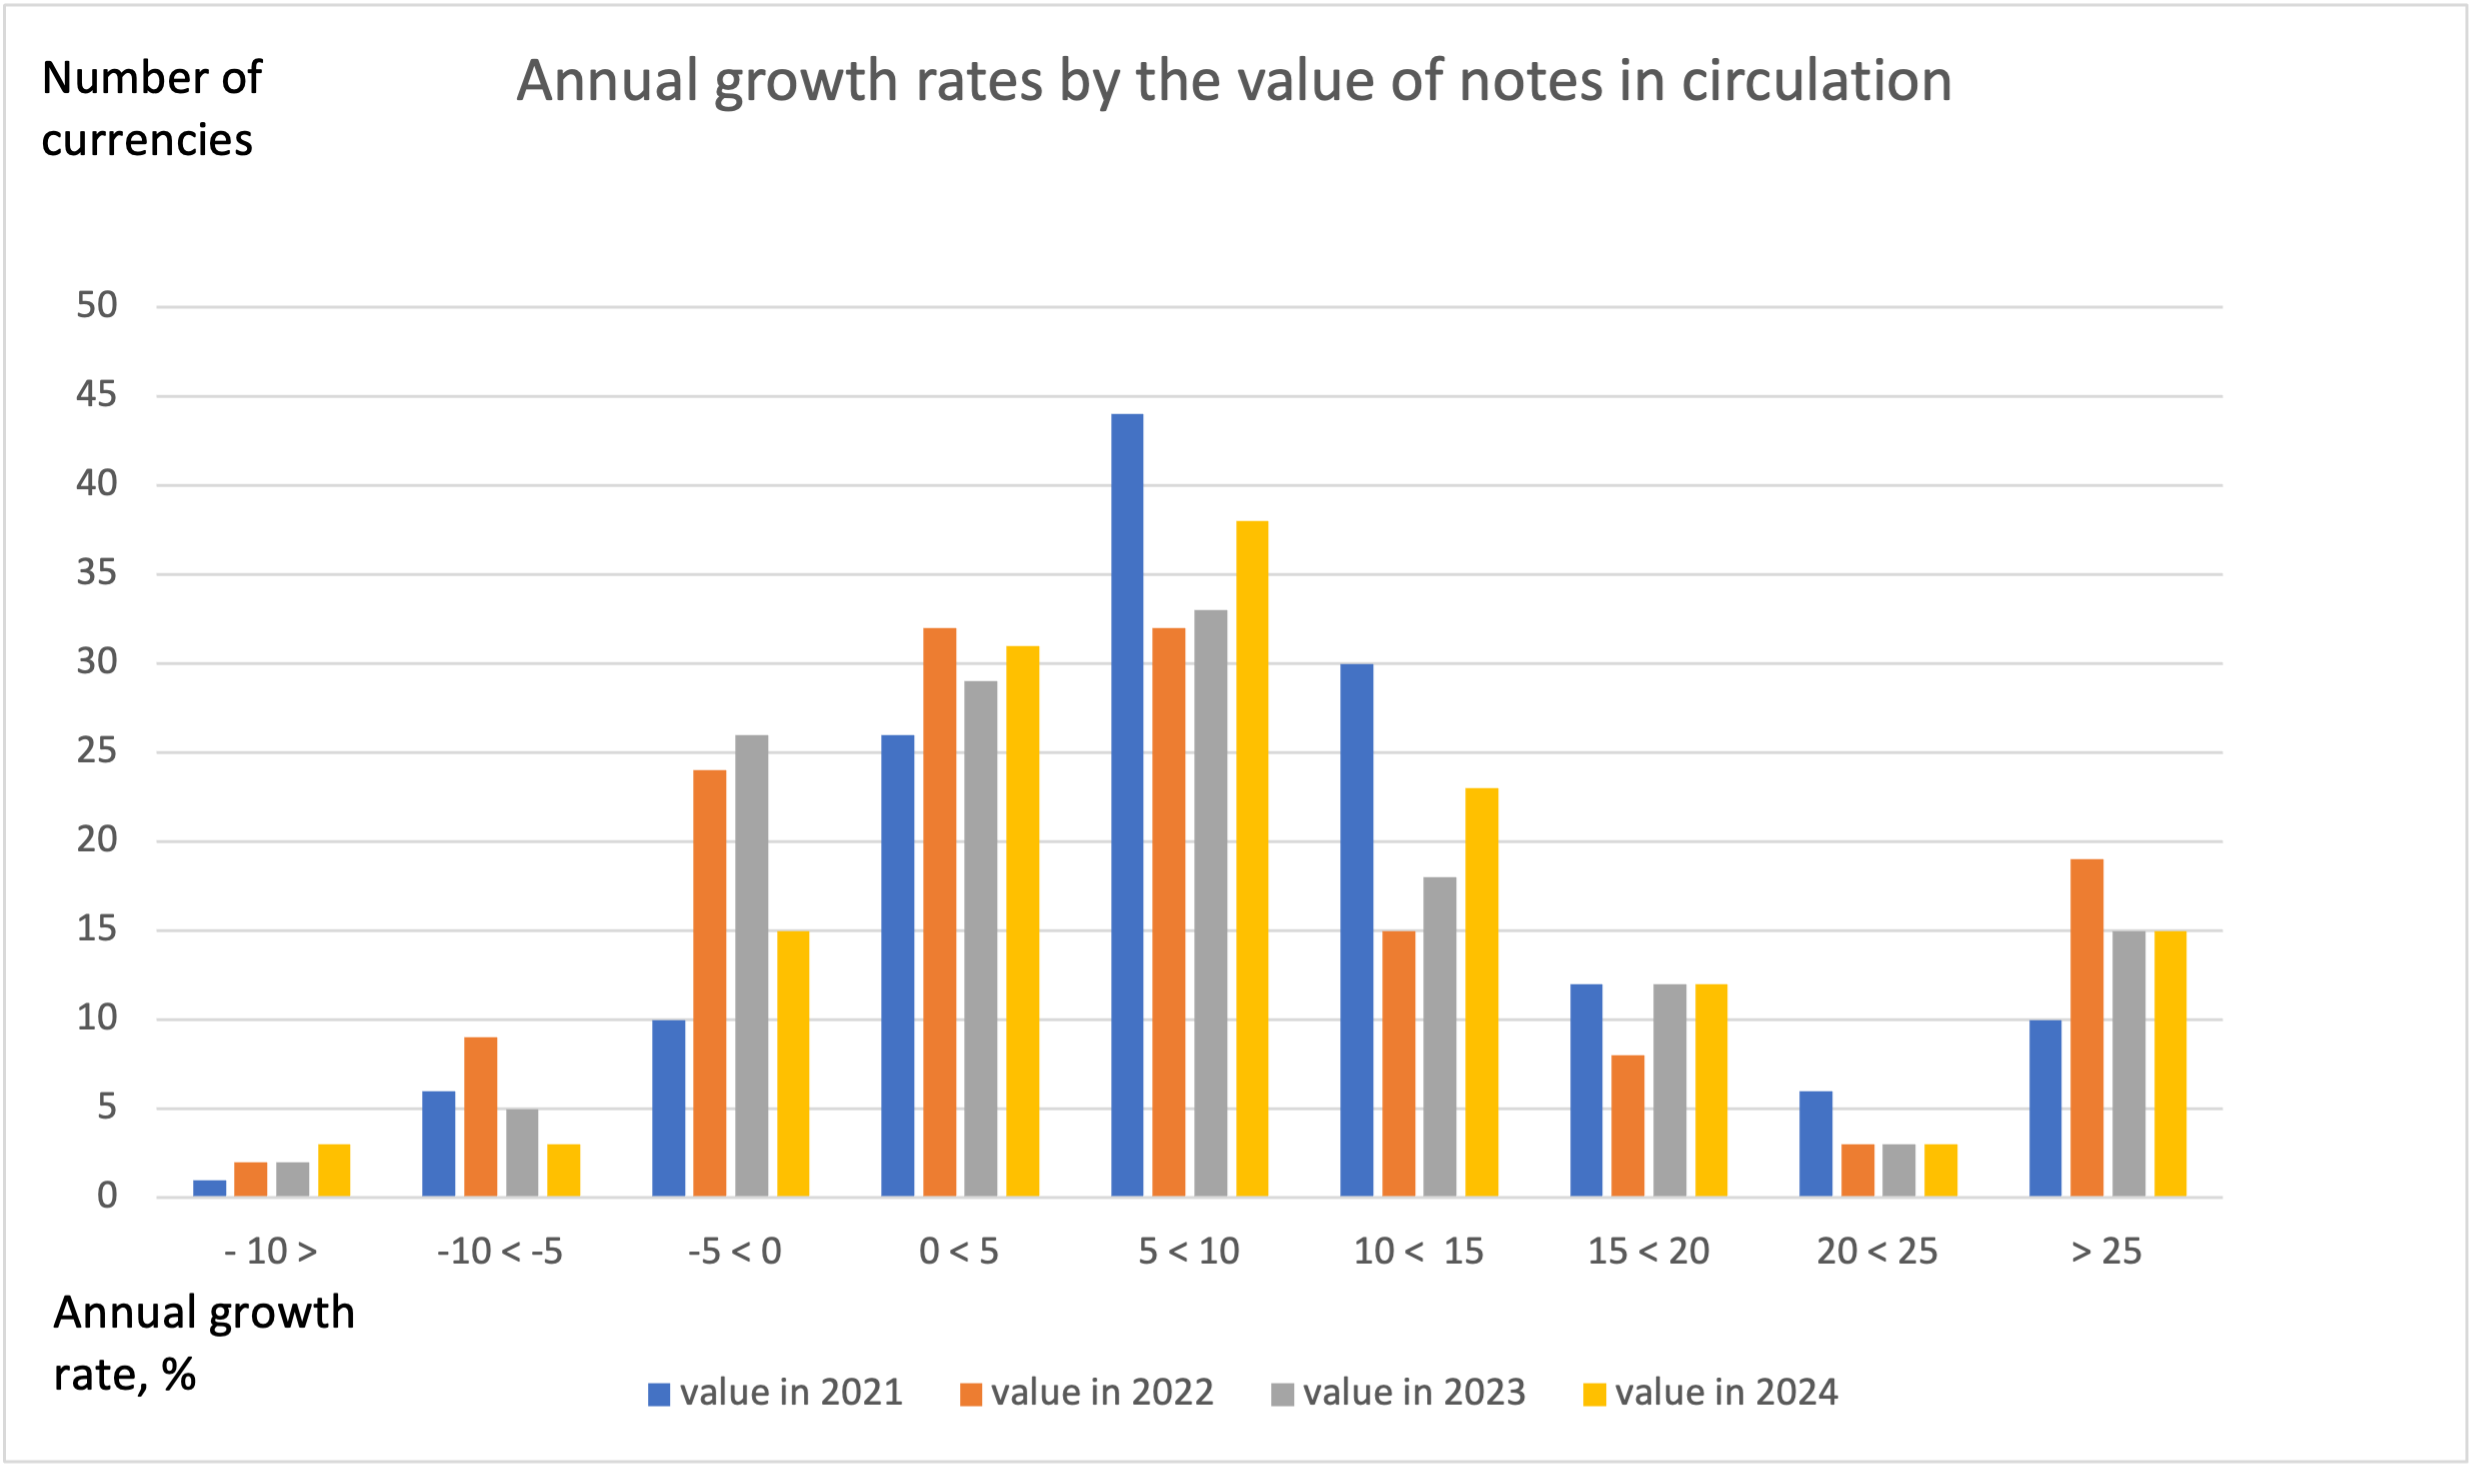
Figure 1: Annual growth rates by value of banknotes in circulation in 2021−2024 (143−145 currencies)
It is not easy to draw any conclusion based on Fig. 1. When comparing the development in 2024 to that in the other three years the best guess is that the bars in 2024 are closest to those in 2021. The distribution in 2021 indicated a return to normality after the Covid 19- pandemic, and the higher-than-normal cashMoney in physical form such as banknotes and coins. More balances accumulated during the pandemic were not yet abandoned. The public’s behaviour changed in this respect first in 2022, when the growing opportunity cost motivated the public to reduce their cash balances. This is indicated in Fig.1 by the high number of negative growth rates in 2022 and 2023.
Whether there was a kind of return to normality in 2024 is further studied in Figure 2. It illustrates the annual median growth rate of the value of banknotes in circulation in 2013−2024.
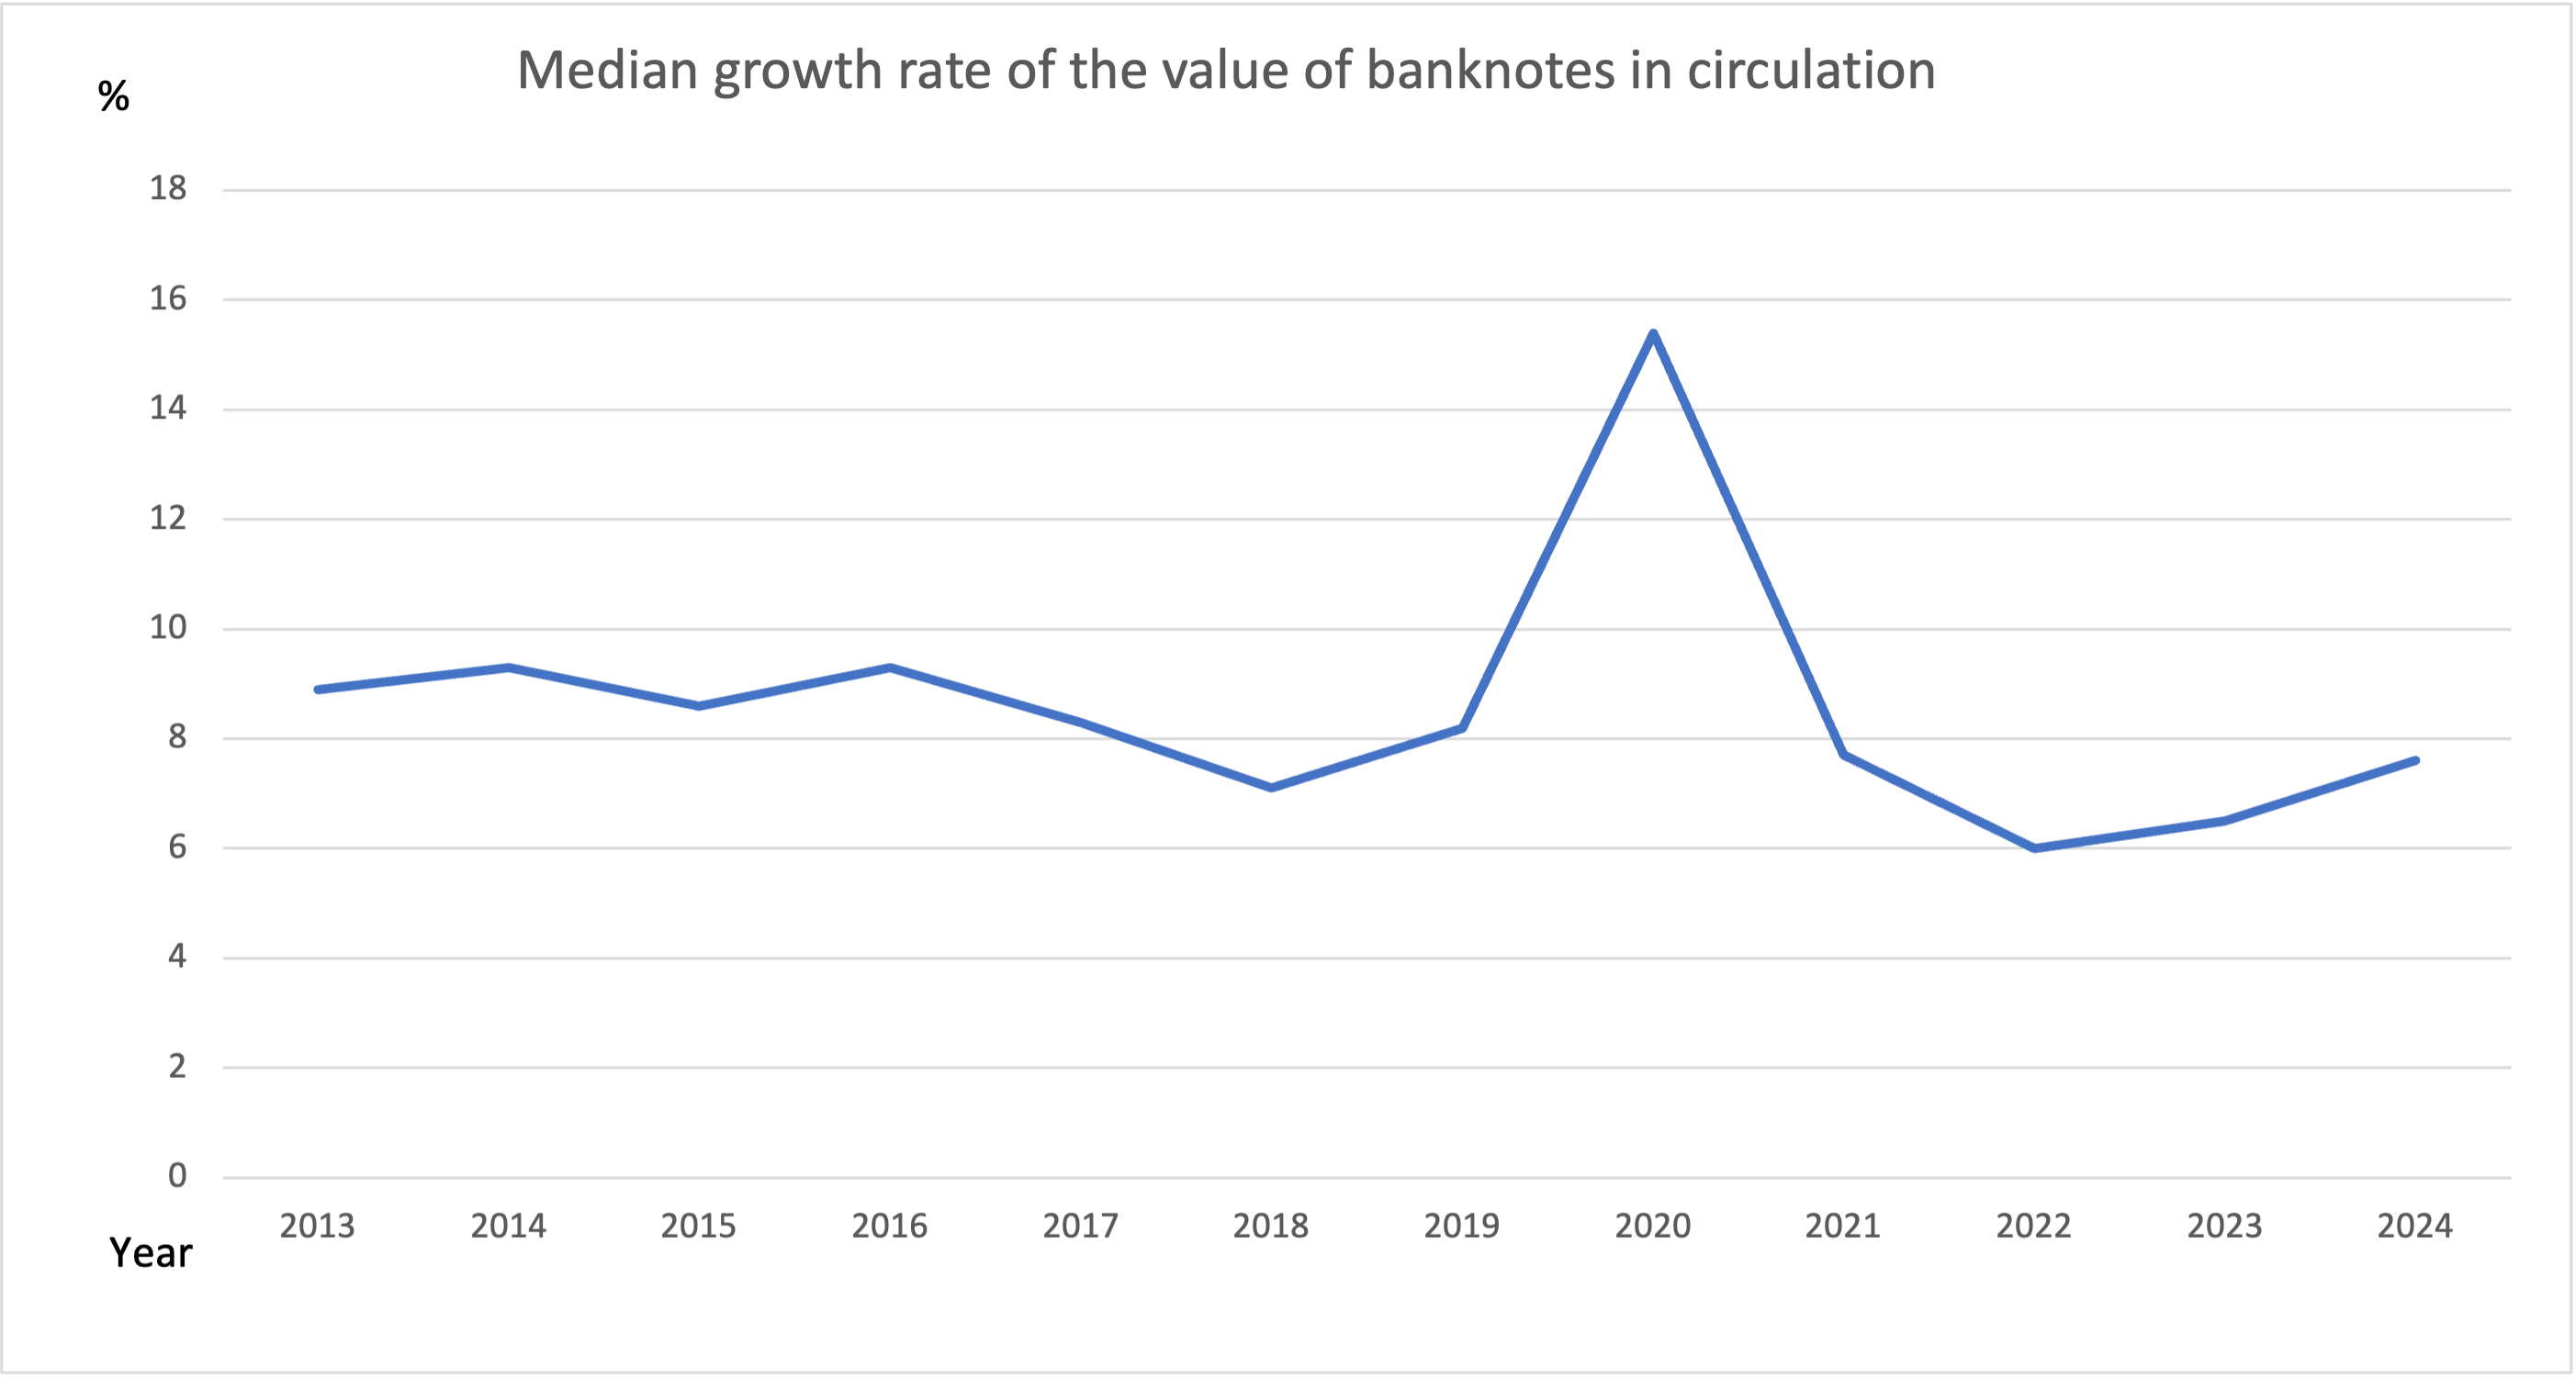
Figure 2 Median growth rate of the value of banknotes in circulation in 2013−2024 (143−145 currencies)
Based on Fig. 2, the median growth rate is indeed returning to the earlier slightly decreasing trend which was thrown into disarray during the pandemic and its aftermath. This is the conclusion regarding the growth of the value of notes in circulation. Next developments of the volume growth will be addressed.
Banknote circulation in volume terms
Even though most studies related to the banknote circulation analyse its development in value terms, the volume developments are much more important to the industry and stakeholders of the cash cycleRepresents the various stages of the lifecycle of cash, from issuance by the central bank, circulation in the economy, to destruction by the central bank. More.
The pandemic accelerated the changeThis is the action by which certain banknotes and/or coins are exchanged for the same amount in banknotes/coins of a different face value, or unit value. See Exchange. More of paymentA transfer of funds which discharges an obligation on the part of a payer vis-à-vis a payee. More habits towards digital payments and simultaneously the growing uncertainty increased the precautionary and store of valueOne of the functions of money or more generally of any asset that can be saved and exchanged at a later time without loss of its purchasing power. See also Precautionary Holdings. More demand for banknotes. This was mirrored in the demand for high denominationEach individual value in a series of banknotes or coins. More notes. Therefore, the growth of the volume demand for banknotes has been lower than that of the value.
The denominational data on banknote circulation has regrettably less coverage on central bank websites than its total value. Therefore, those central banks which don’t publish the denominational data are encouraged to do so. The global updates would be then more representative.
Anyway, thanks to several central bank colleagues, who generously provide data for these global updates, the publicly available data has been complemented with several additional currencies. Accordingly, the annual growth rates of the number of banknotes in circulation were available in 2024 for 104 currencies. Figure 3 addresses the distributions of the growth rates by the number of banknotes in circulation in years 2021−2024.
Some figures refer to end of the financial year, not to the end of the calendar year. The reason is that the respective central banks publish the volume figures only at the end of their financial year.
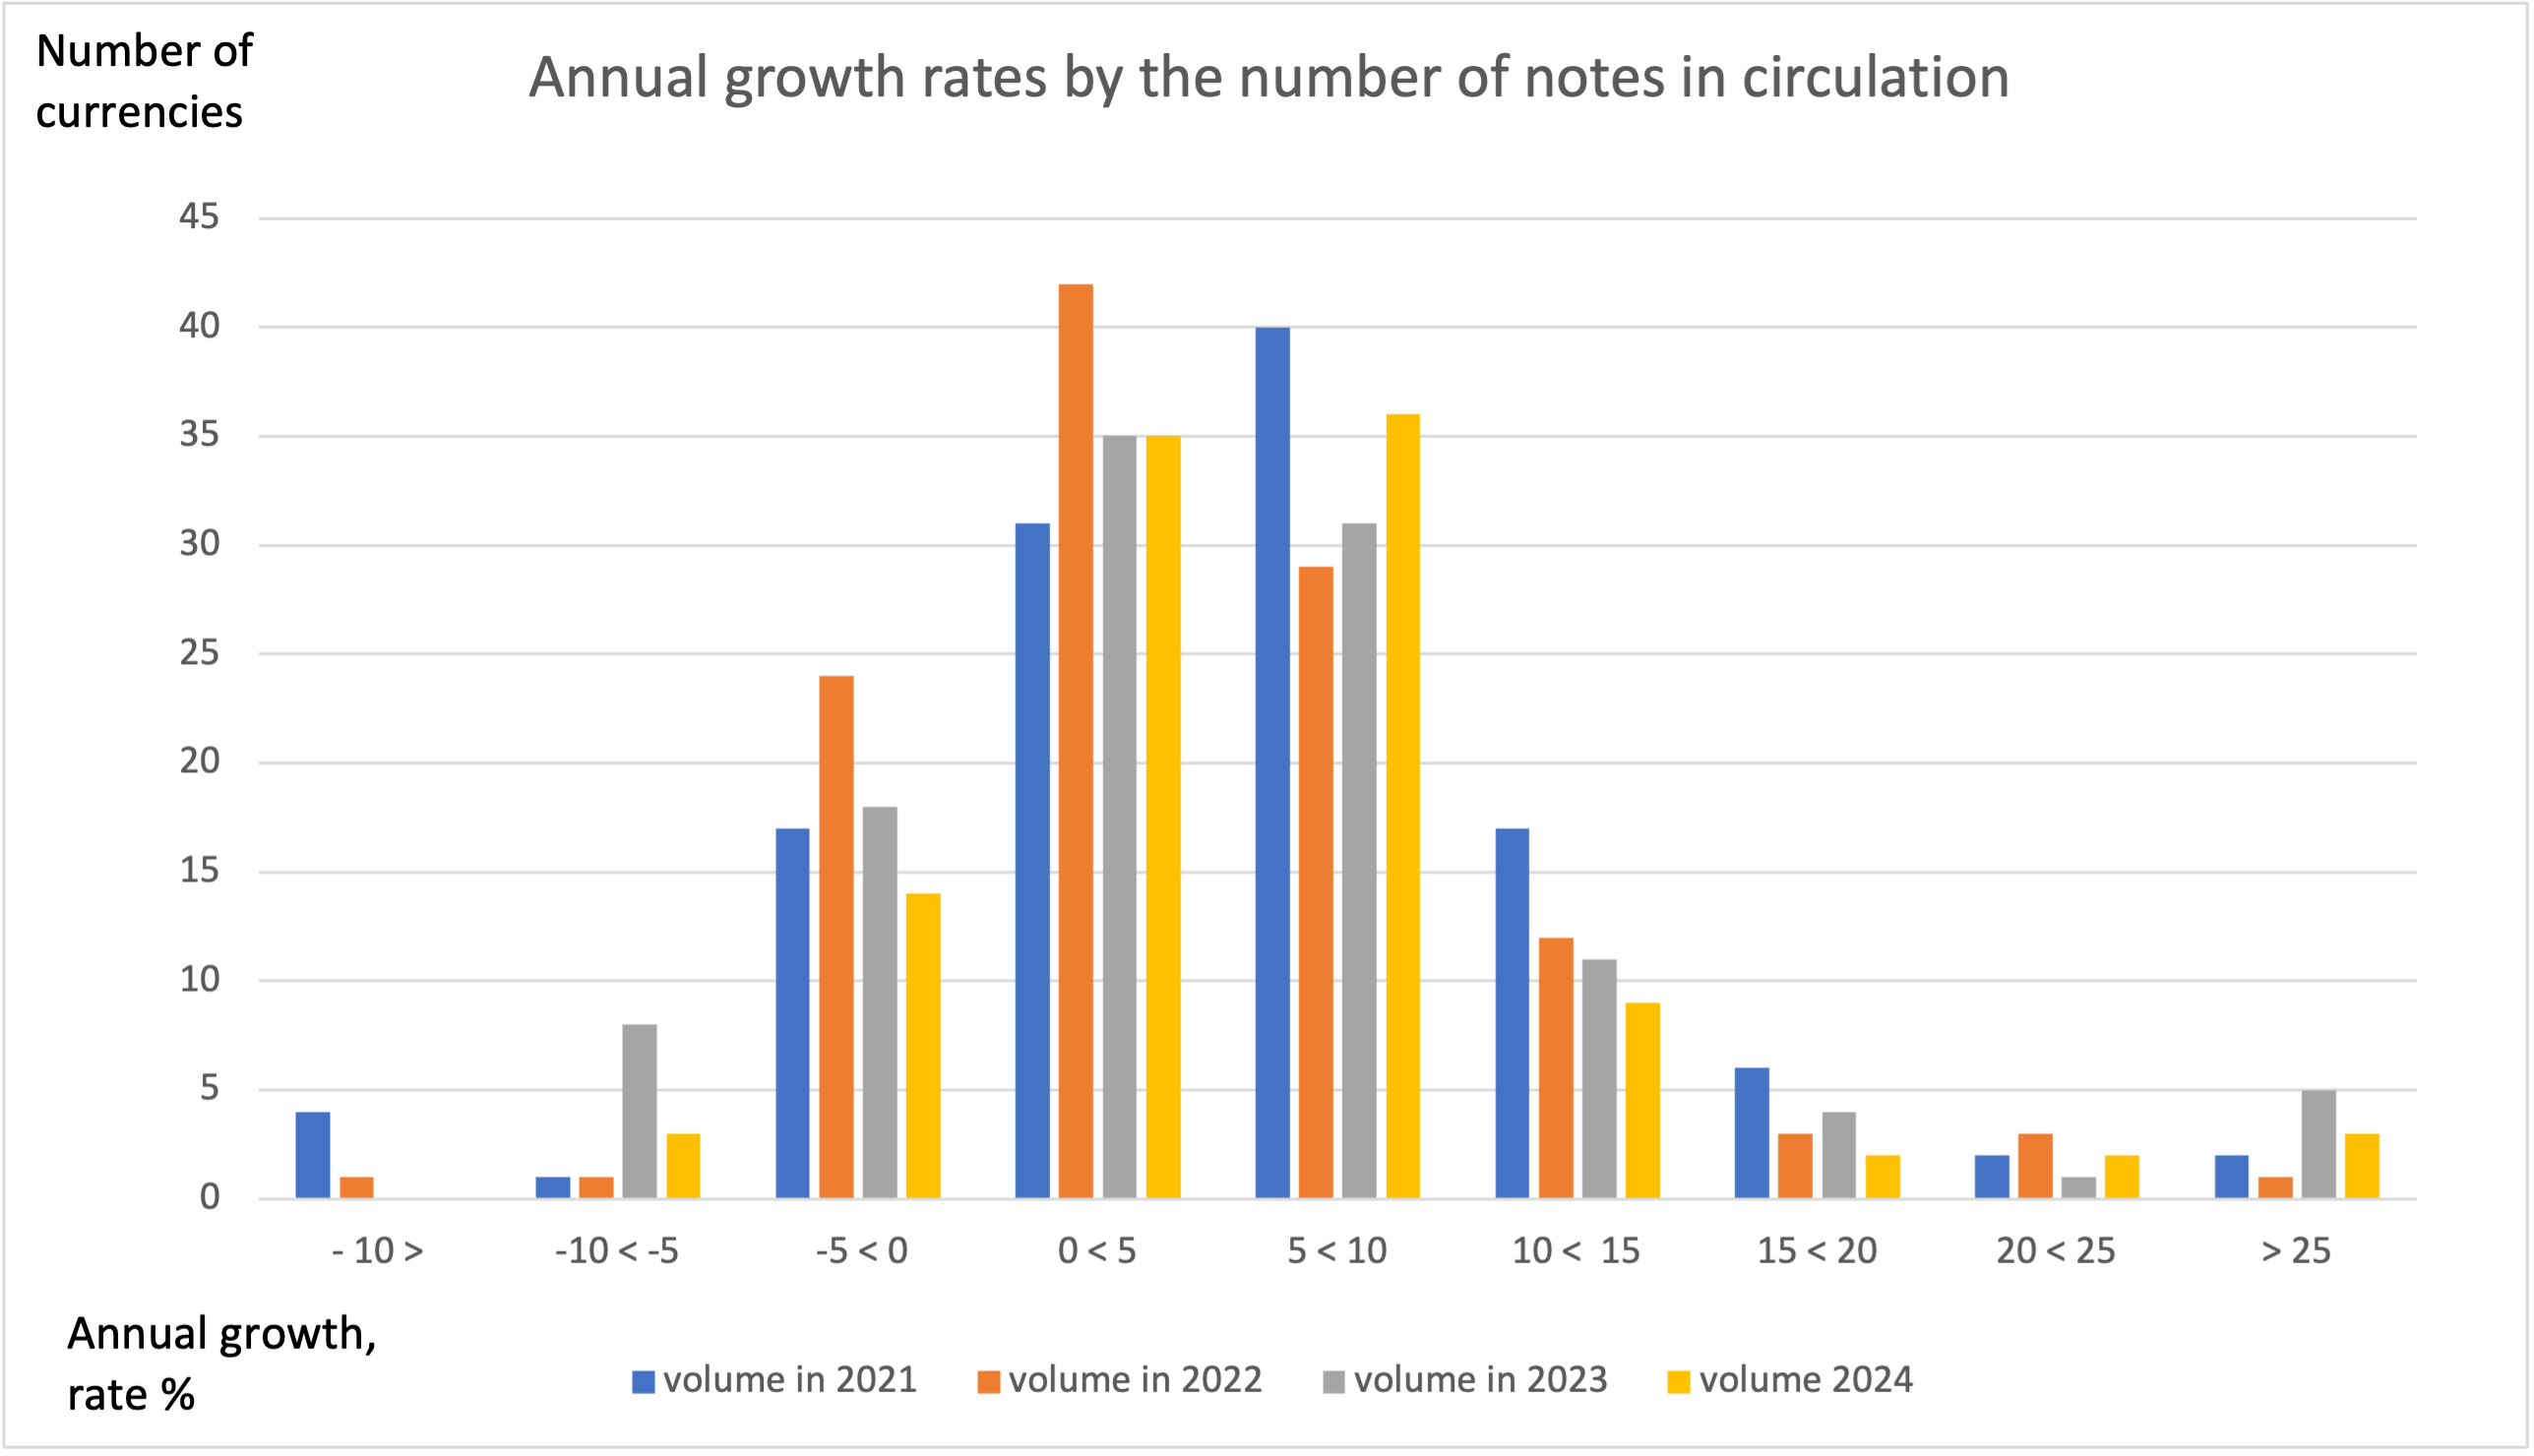
Figure 3: Annual growth rate by the number of banknotes in circulation of 104 currencies in 2021−2024.
It is difficult to draw any firm conclusions on the direction of the volume development. It seems, however, again that the distribution in 2024 is closer to that in 2021 than those in 2022 and 2023.This assumption is further analysed in Figure 4 which illustrates the share of currencies with a positive growth rate in the years 2013−2024.
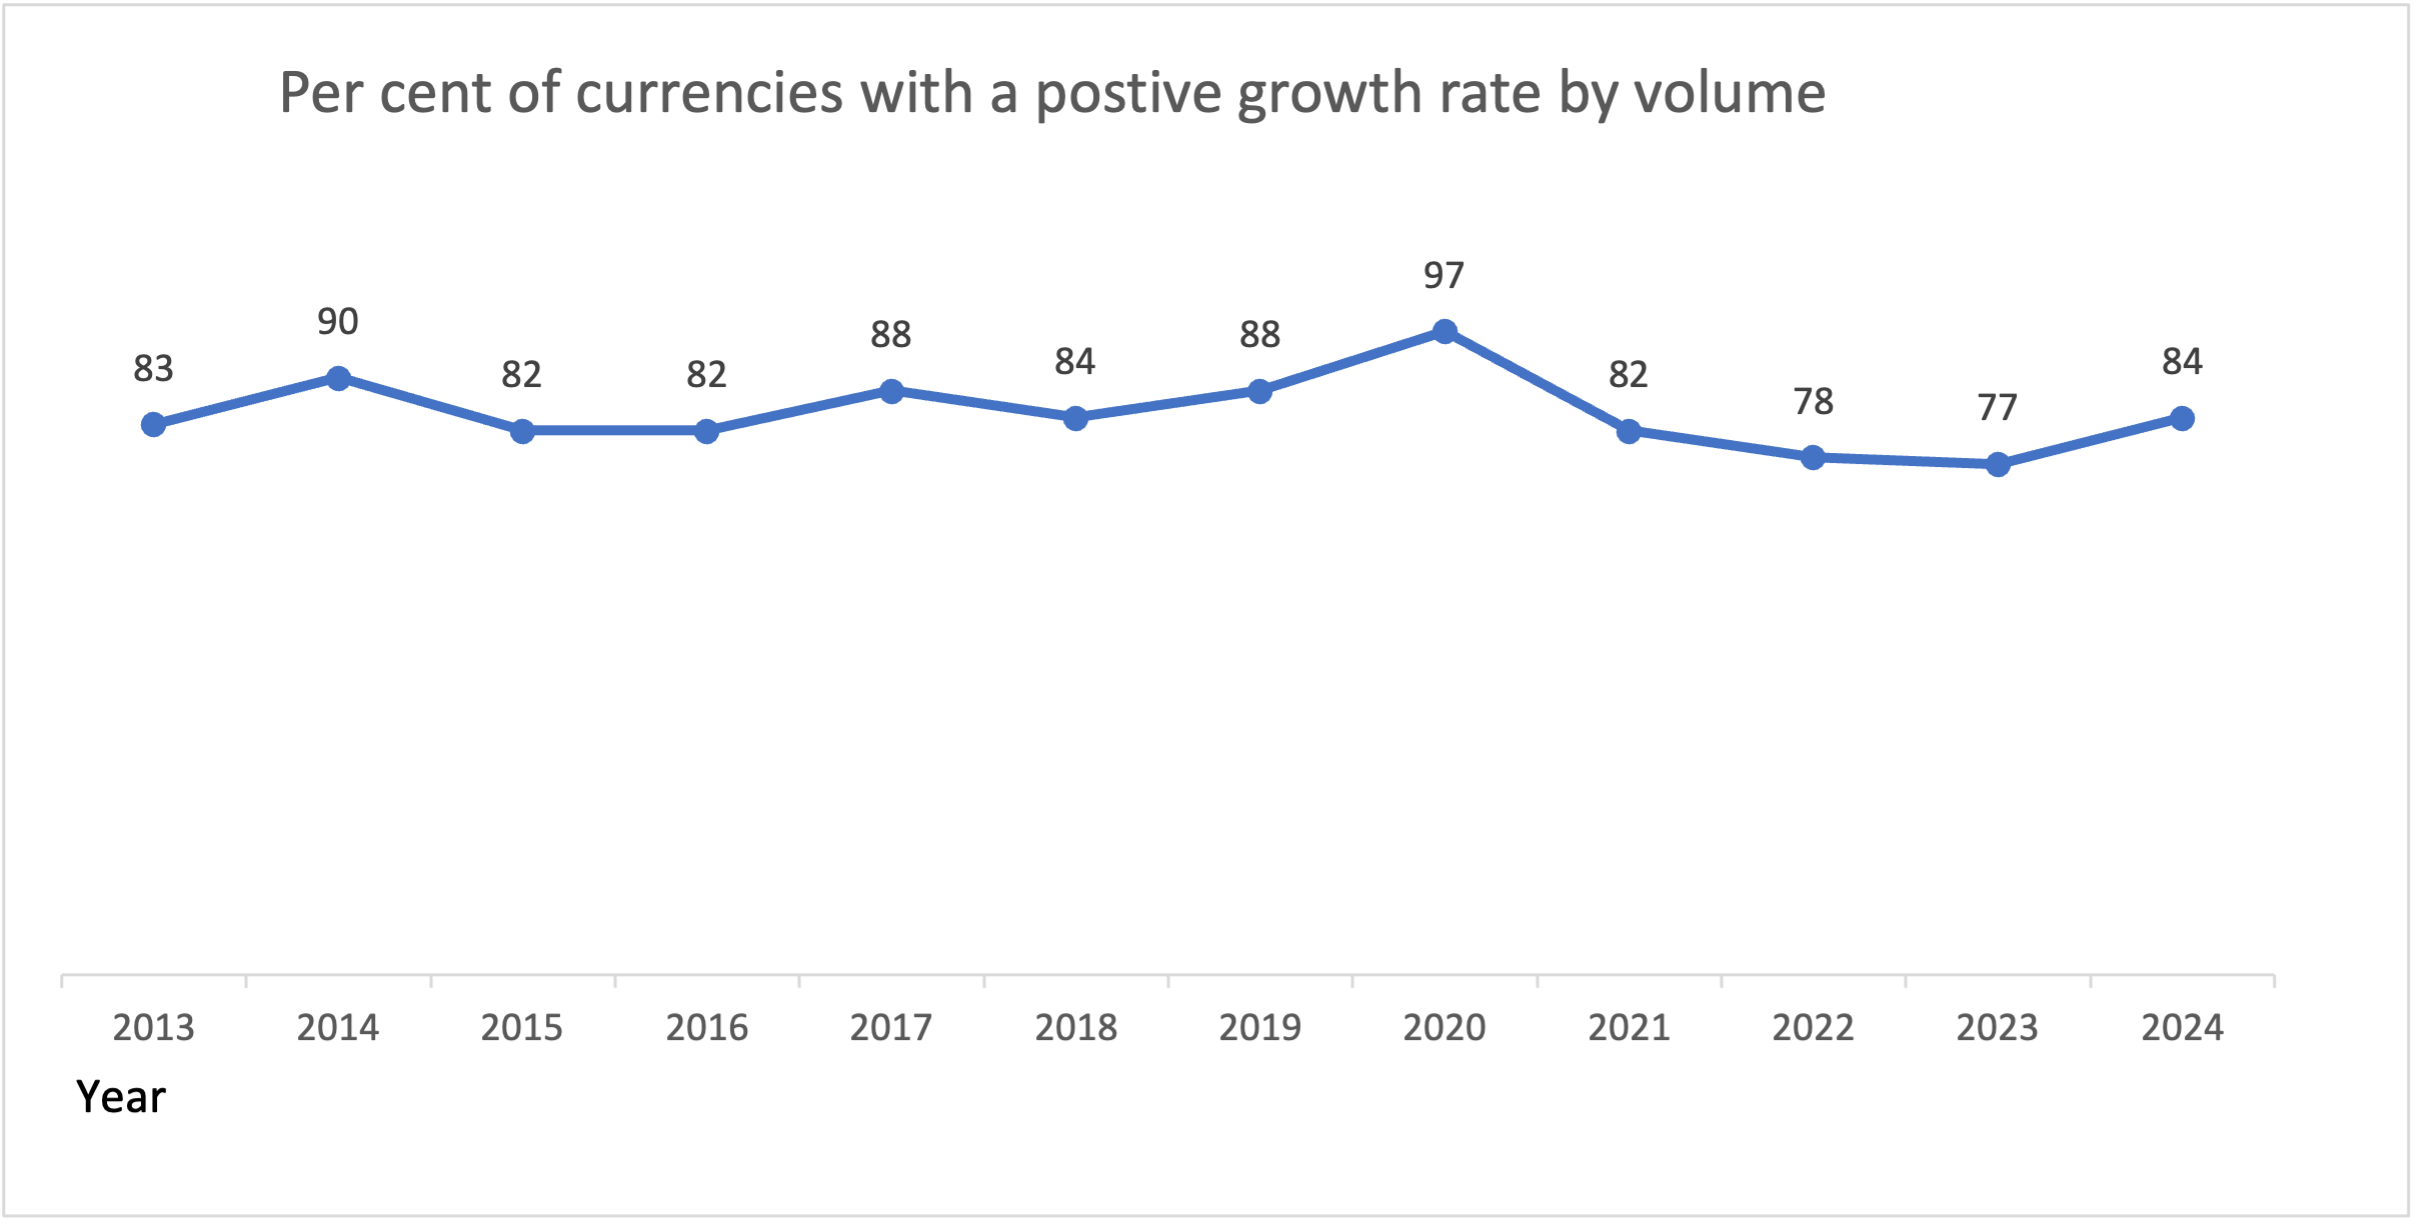
Figure 4. Per centFraction of a currency representing the hundredth of the unit of account. More of currencies which had a positive growth rate by the number of banknotes in circulation in 2013−2024, on average 111 currencies
Similarly, as Fig. 3 also Fig. 4 indicates that the growth rate of the number of banknotes in circulation has bent towards the earlier trend. In years before the pandemic the number of currencies having a positive growth rate in volume terms was more than 80%, and in 2024 clearly so.
Impact of the use of other payments methods on the introduction of new high-end notes
Historically, most issuing authorities regularly made inflation corrections to the currency structure. New higher denomination notes were introduced, and simultaneously low-end notes were replaced with coins. In the September analysis, it was concluded that this is only partly true regarding the low end.
During the last couple of decades an increasing number of digital payment methods has been developed. Hence, it is interesting to study what kind of impact these new payment methods have had on the introduction of new high-end notes.
The impacts will be first studied using latest available statistics and classifying the currencies based on the dateThe year in which a medal or coin was minted. On a banknote, the date is usually the year in which the issuance of that banknote - not its printing or entering into circulation - was formally authorised. More of introduction of the current high-end note denomination. The results are depicted in Figure 5. Each bar describes the number of new high-end denominations introduced during various 10-year periods.
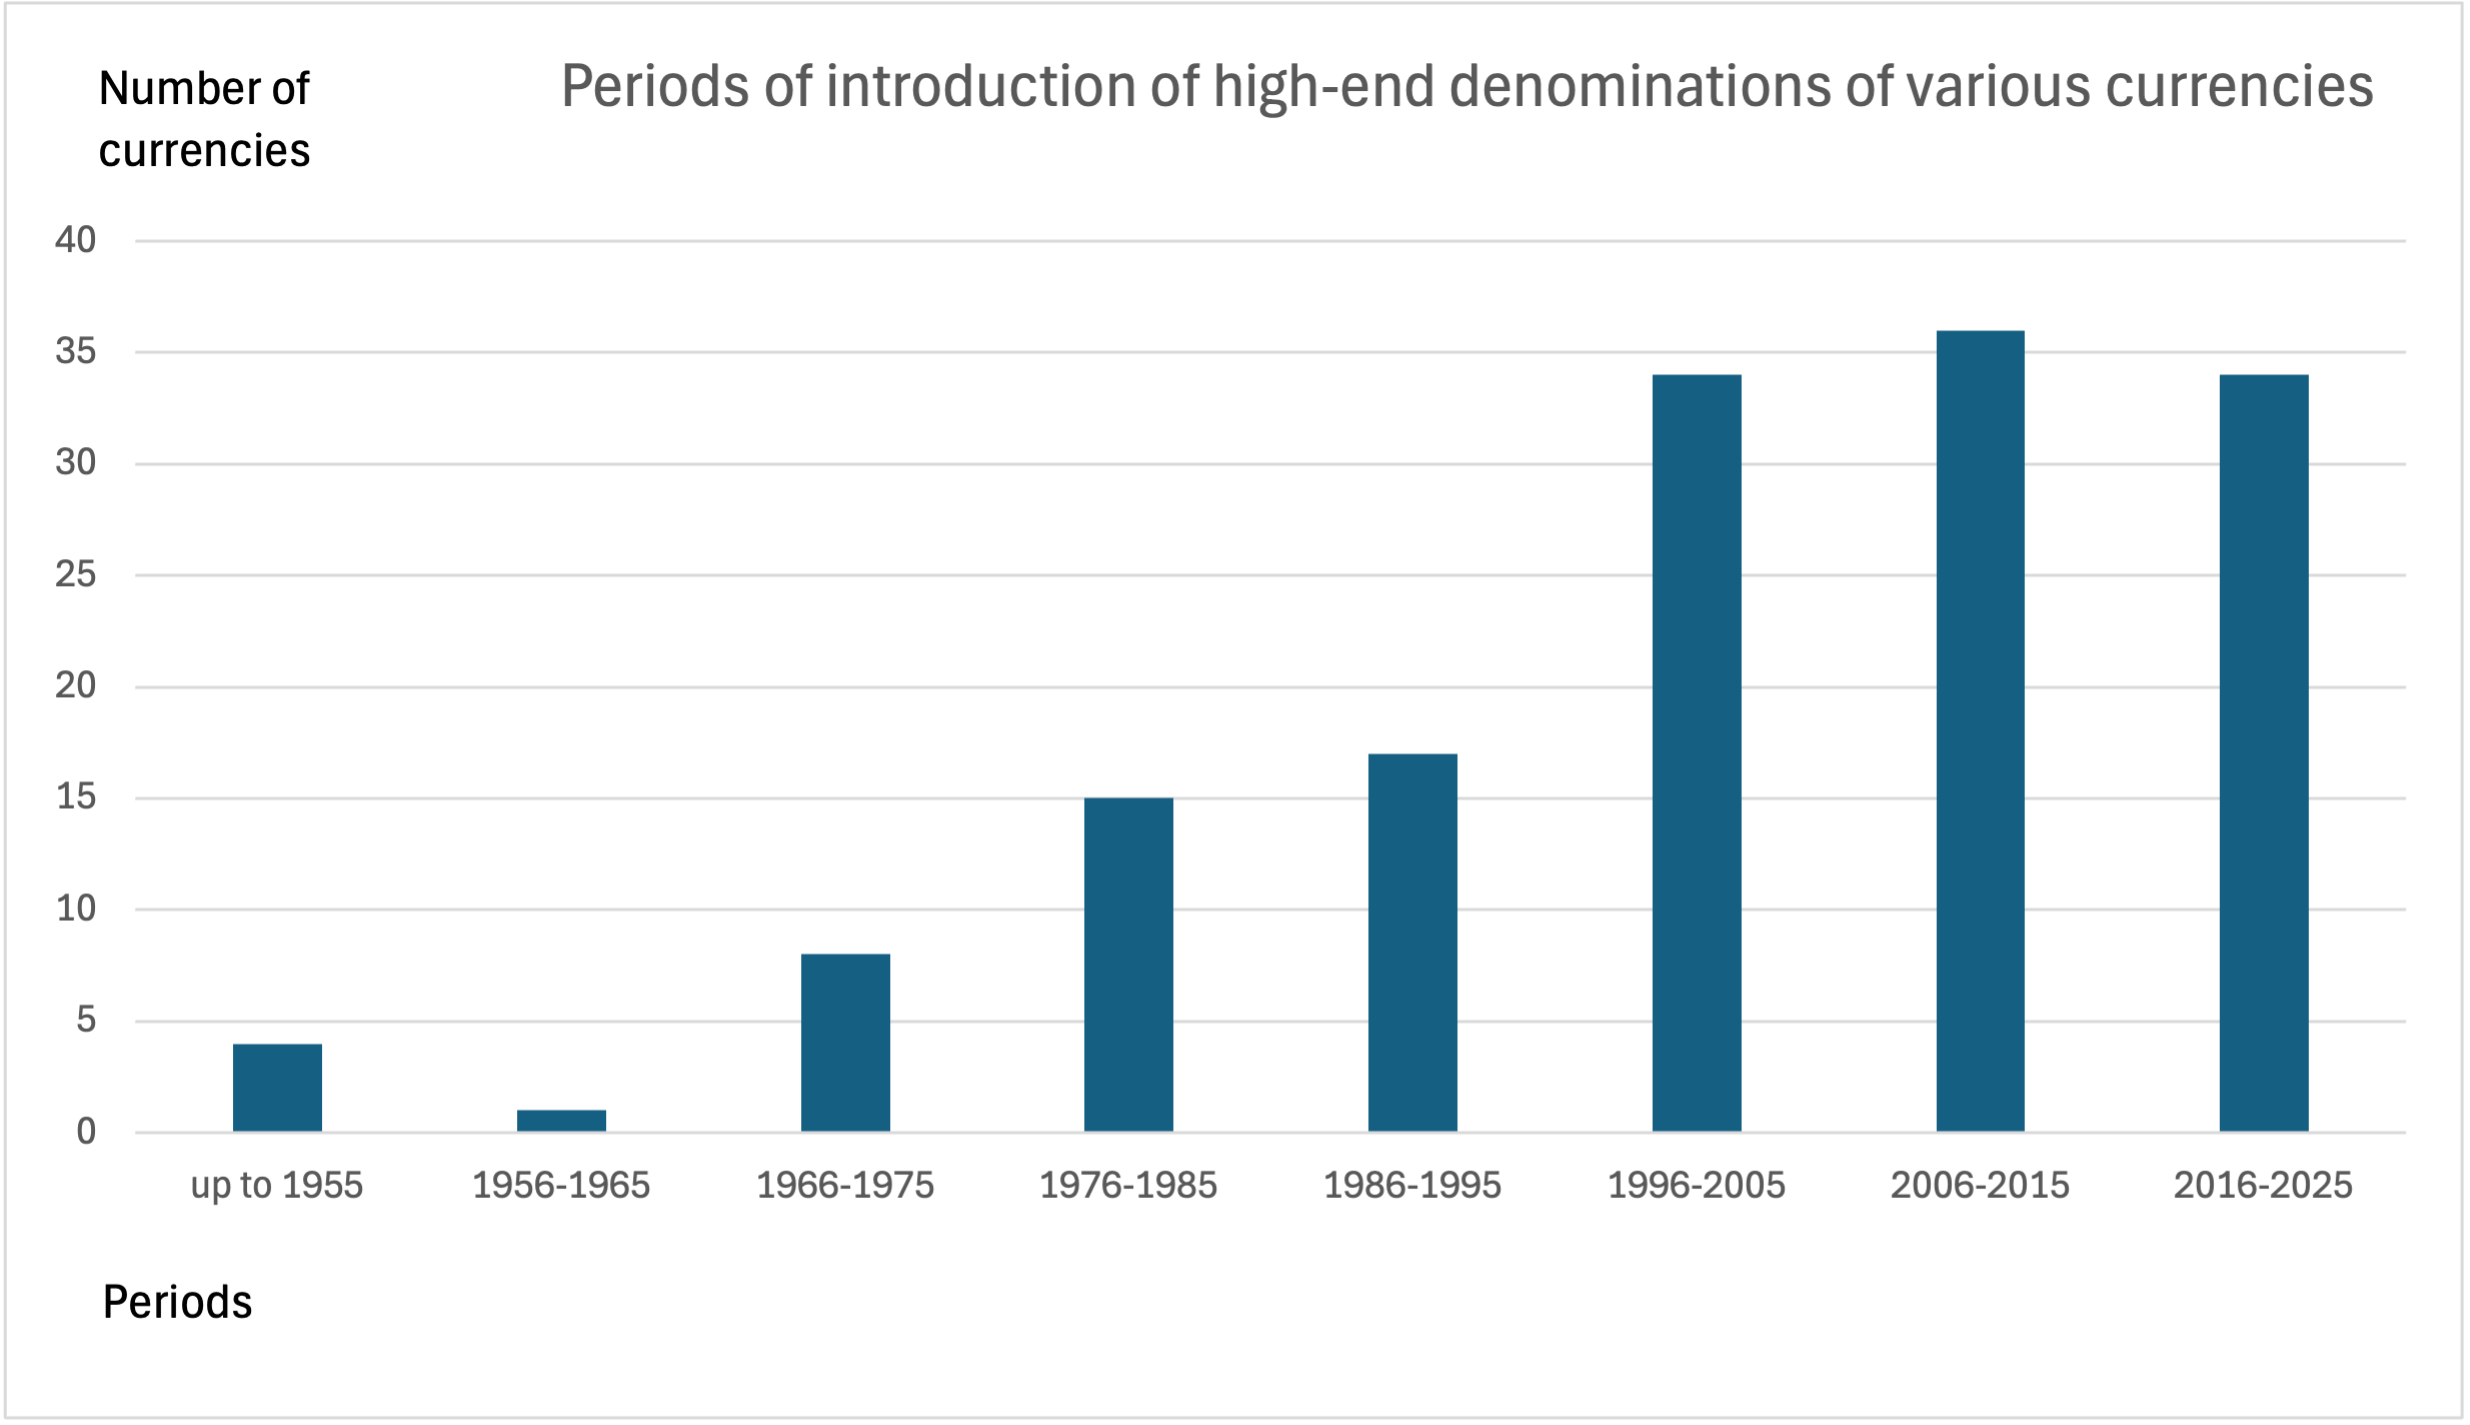
Figure 5. Periods of introduction of high-end notes of various currencies (149 currencies).
According to Fig. 5, roughly the same amount of the currently circulating high-end note denominations, around 35, were introduced during each of the last three 10-year periods. Another interesting observation is that the highest denomination of four currencies hasn’t changed since 1955. In Norway the 1,000-krone note has been the high-end denomination since 1877 and 1,000 francs respectively in Switzerland since 1907. The high-end denomination of Japanese yen is a bitIn computers, the basic unit of digital information; contraction of BInary digiT. More younger. 10,000 yen was introduced in 1958.
Evidently, the purchasing power of these notes has decreased significantly during the years, but in all three cases the denominations are still in line with that of high-end denominations of other currencies and adequate for the store of value function of banknotes. 1000 NOK is around 100 USD, 1000 CHF is in its own category among major currencies and worth more than EUR 1,000, and JPY 10,000 is around GBP 50.
Fig.5 gives the impression that the introduction of new high-end denominations has slowed down because their number during the last decade is a bit lower than during the earlier ten-year period. To get a more precise understanding of the development, another vantage point is selected. The year 1999 has been selected as an alternative date, because the acceleration of new payment innovations has really taken place only during the last couple of decades. A similar chart as in Fig. 5 is presented having 1999 as the vantage point.
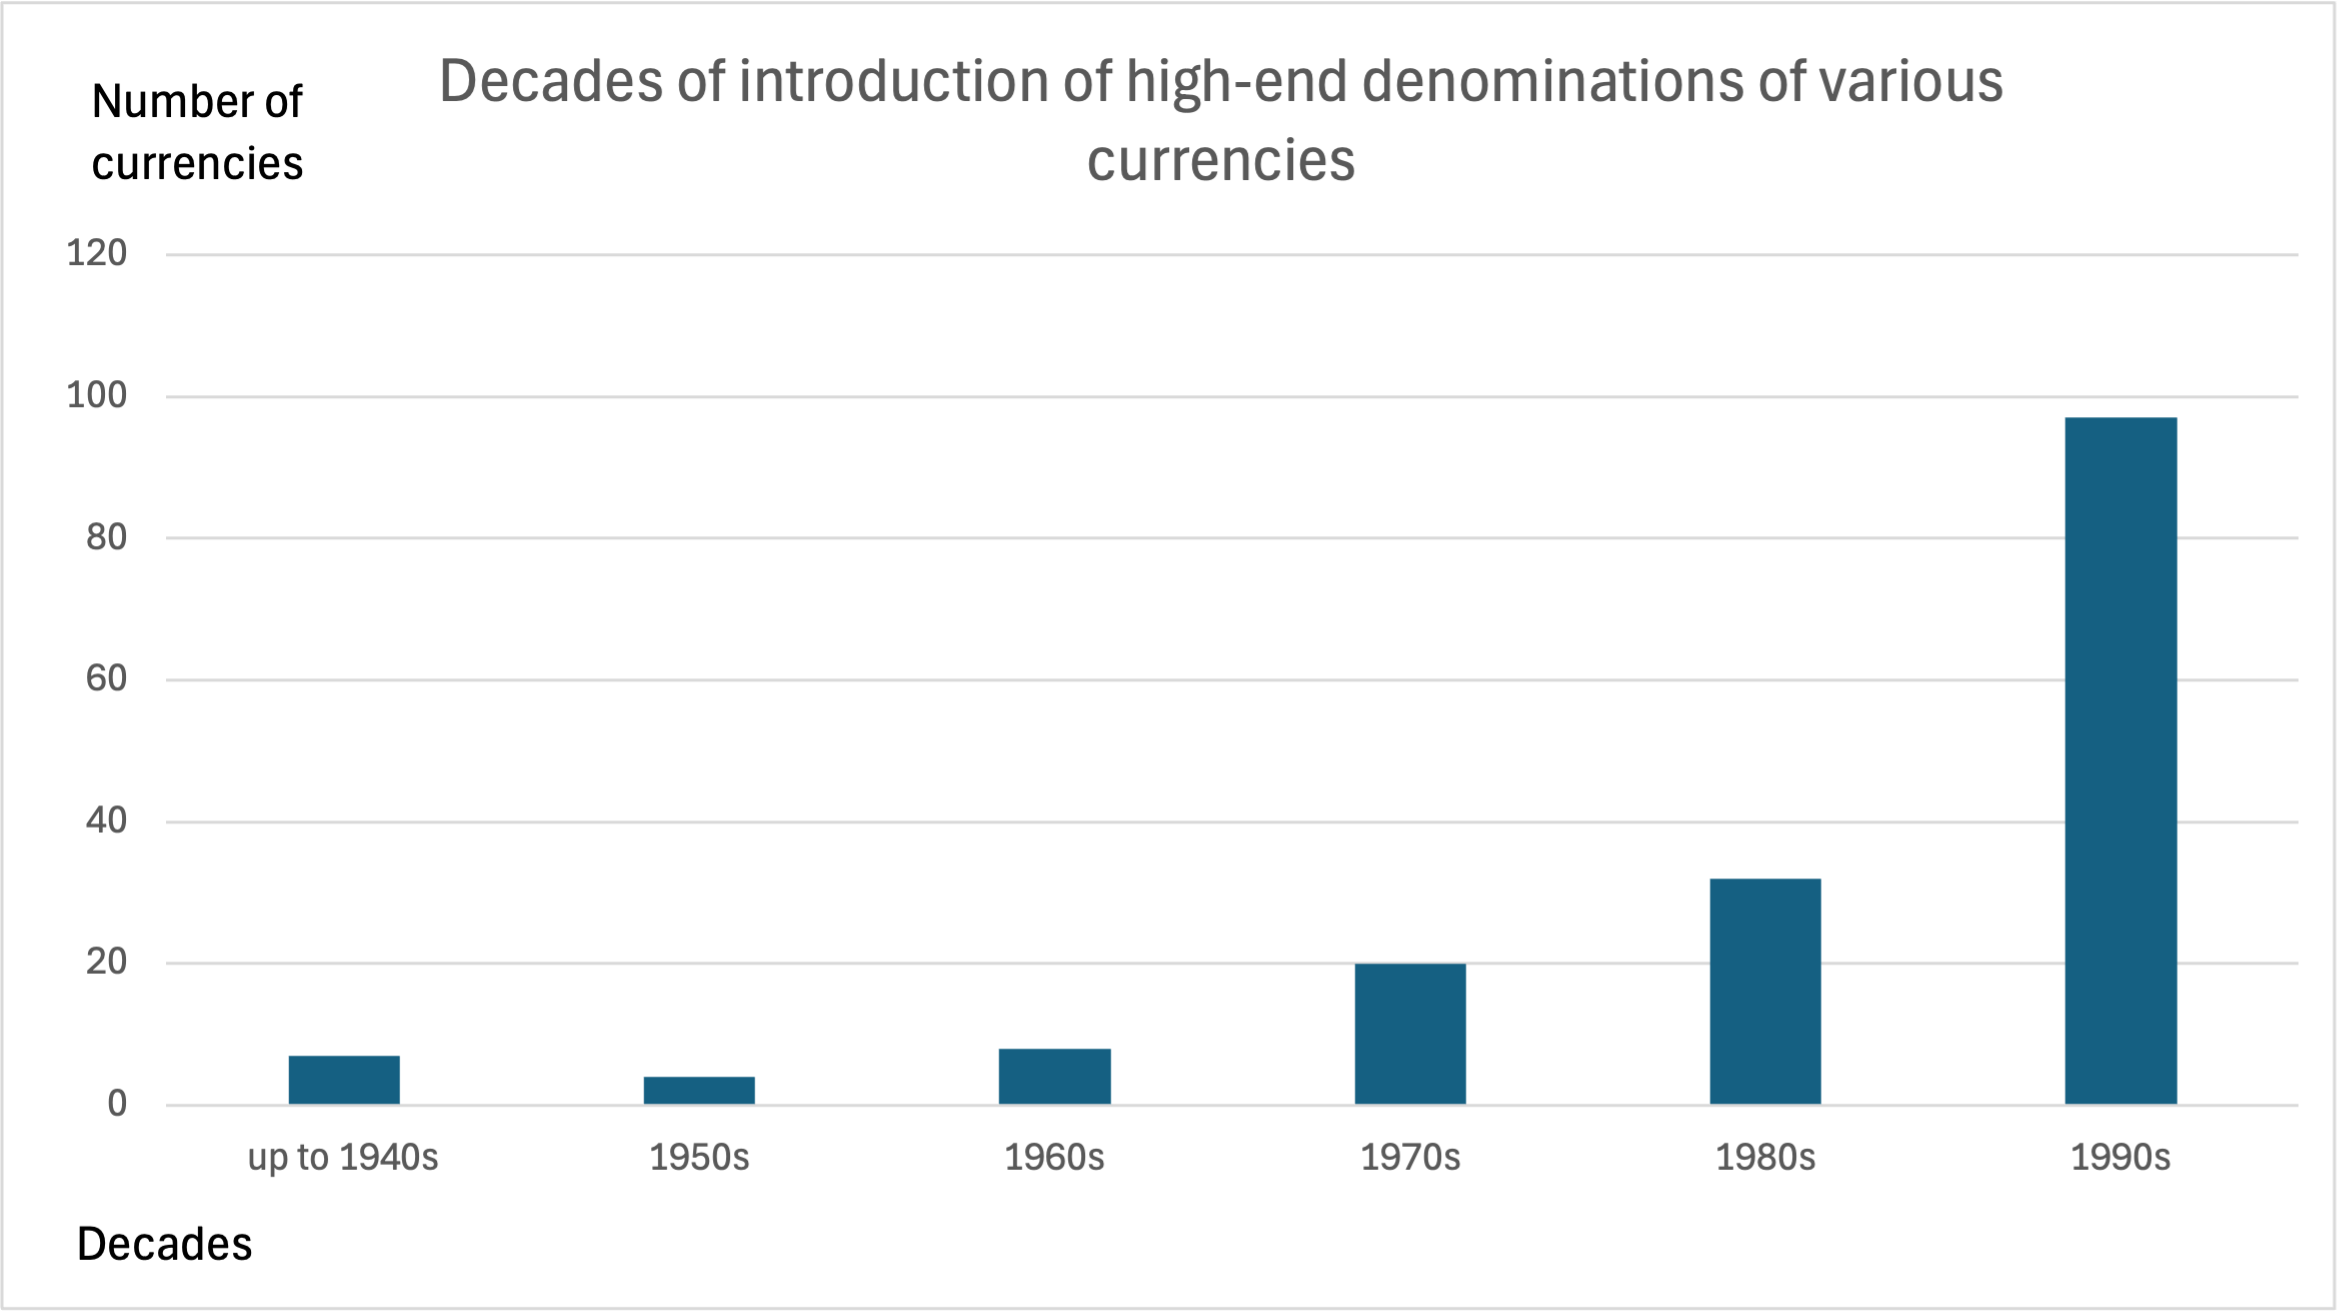
Figure 6. Decades of introduction of existing high-end banknotes in 1999 (168 currencies)[1].
Fig. 6 gives remarkably different impression from Fig. 5. This is the case even if one takes into account the collapse of the Soviet Union and Yugoslavia and the post-collapse transitions in many countries in the 1990’s.
According to Fig. 6, a new high-end denomination was introduced by close to 100 currencies during the 1990’s, while there were still very few instant payment alternatives to cash for high-value payments. Hence, even if the world inflation was decreasing in 1990’s from the double-digit figures of 1980’s, the mindset of issuing authorities hadn’t changed. They still saw the need to issue new high-end notes, as reflected in Fig. 6.
An additional explanation for the large number of new high-end notes was probably the frequent upgrading of the whole banknote series. It was another feature typical in the 1990’s because of the continuous developments in the digital reproduction technology. In the context of a new series, the question whether to change the currency structure was usually topical. Recently, the average life of a banknoteThe time, on average, between the first issuance of a banknote and its withdrawal from circulation by the issuing central bank. High-value denominations usually have a longer average life than low-value ones which, due to their more frequent usage, deteriorate faster. More series has increased , and the consideration of currency structure has become less frequent.
Based on Figures 5 and 6 the introduction of new high-end notes has significantly slowed down. That raises the question, in which scope high-end denominations have been withdrawn from circulation because of introduction of new payment methods. There are some historical examples, e.g. the Bank of England issued still during World War II denominations up to 1,000 pounds and the United States hasn’t issued 500−10,000-dollar notes since 1969. It is also well-known that the €500 hasn’t been issued since April 2019 and was not included in the current Europa series of euroThe name of the European single currency adopted by the European Council at the meeting held in Madrid on 15-16 December 1995. See ECU. More notes. Also, the Danish 1,000-krone note will not be part of the new note series scheduled for 2028−29, and the last day of the current 1,000-krone banknote as a valid means of payment was 31 May 2025 .
Other recent examples relevant to the question are the following: The Riksbank withdraw 10,000-krona note in 1991, Bank Negara Malaysia demonetized RM500 and RM1,000 notes in July 1999, Bank of Canada withdraw the 1,000-dollar note in 2000 and the Reserve BankSee Central bank. More of India demonetised ₹ 1,000 in November 2016 and issued ₹2,000 banknotes in exchangeThe Eurosystem comprises the European Central Bank and the national central banks of those countries that have adopted the euro. More. The latter lost legal tenderMoney that is legally valid for the payment of debts and must be accepted for that purpose when offered. Each jurisdiction determines what is legal tender, but essentially it is anything which when offered (“tendered”) in payment of a debt extinguishes the debt. There is no obligation on the creditor to accept the tendered payment, but the act of tendering the payment in legal tender discharges the debt. More status in September 2023. Moreover, the National Bank of the Republic of Macedonia withdraw the 5,000 denar note in December 2016 and the Autoriti Monetari Brunei Darussalam the BND 10,000 note in November 2020. Also, in Israel various sources have raised the cancellation of the highest denomination, 200 shekel note, but the Governor of the Bank of Israel has strongly denied any justification for that.
Based on these less than 10 examples during the last 30+ years, the availability of new payment methods for high-value transactions hasn’t been reflected to a great extent in the withdrawal of existing high-end denominations.
One may ask what these developments mean for the cash industry? If the arguments are valid and related to the increasing use of other payment instruments for high-value transactions and the high-end note is sufficient for the store of value function of cash, they are justified. However, if the arguments are related to money launderingThe operation of attempting to disguise a set of fraudulently or criminally obtained funds as legal, in operations undeclared to tax authorities, and therefore not subjected to taxation. Money laundering activities are strongly pursued by authorities and in most countries, there are strict rules for credit institutions to cooperate in the fight against money laundering operations, to declare and report any transactions that could be considered suspicious. More or other misuses, they should be set in proportion to the digital payment fraud.
Concluding remarks
This year’s update of the global demand for banknotes gives a more positive impression of the development than the two preceding annual updates. Both the value and volume growth has bent towards the trends existing before the Covid-19 pandemic.
Impacts on the currency structure are another interesting trend. Both the note/coin boundary and the high-end note are not changing as often as they used to do in 1990’s.
However, these end-of-year assessments provide only a partial picture of the situation. They don’t tell anything about the flow variables, like production, processing, transport or destruction of notes . The impacts of decreasing volumes on the cash cycle are already seen in a few countries and put pressure on the maintenance of the cash infrastructure. The key challenge regarding the future role of cash, is the opposite development trends of the two motives to use cash: its demand for transactions on the one hand and as a store of value or for precautionary reasons on the other. Therefore, central banks need a serious plan for the maintenance and development of the cash infrastructure, which is vital for a well-functioning society.
[1] Introduction of euro notes explains the difference in the number of currencies included in Fig. 5 and 6.