Banknote Developments at the Global Level – Before and After the Outbreak of COVID-19
This article was first published in CurrencyThe money used in a particular country at a particular time, like dollar, yen, euro, etc., consisting of banknotes and coins, that does not require endorsement as a medium of exchange. More News Volume 18 – N° 9 / September 2020. It is republished here with permission of the author.
Besides health concerns, the most severe consequences of COVID-19 are its economic impacts. Not only does the economy suffer due to the imposed lockdowns and travel restrictions, but the pandemic has had and is having a great influence on retail payments. This includes the decrease in the use of cashMoney in physical form such as banknotes and coins. More in transactions, partly based on misconceptions, partly on the overall drop in retail business.
Even if it is still early days to assess the long-term impacts on the future of cash, a few observations can be made. Therefore, this update on banknoteA banknote (or ‘bill’ as it is often referred to in the US) is a type of negotiable promissory note, issued by a bank or other licensed authority, payable to the bearer on demand. More developments at the global level, in its fourth year (see Currency NewsTM September 2017, 2018 and 2019), will begin with a short overview of the developments after the outbreak of COVID-19, before addressing the statistics of 2019.
Furthermore, in order to provide more perspective to the current debate on the future of cash, information on the development of the demand for banknotes during the entire last decade is provided. In this respect, emphasis has been put on the consistency of the data, and therefore some information used in earlier articles has been updated.
Short overview of banknote developments after the outbreak
A number of central banks provide regular statistics about the value of banknotes in circulation on their websites. Up-to-date information is readily available from more than 50 currencies across all continents. Even if these currencies do not represent a scientific sample of all currencies, the information reflects quite well global developments. By using information on 53 currencies the following picture emerges.
In mid-2020 the median annual growth rate of these 53 currencies was 14.5%; the same indicator of these currencies in 2019 which was 6.7%. Therefore, in contrast to the decreasing use of cash in transactions after the COVID-19 outbreak, the precautionary demand for cash has really exploded.
More than 60% of these 53 currencies had their highest annual growth rate of the value of banknotes in circulation during the entire last decade. This points to the importance of cash as a source of trust and resilience in crisis situations, and therefore highlights its role as essential public good and part of the public infrastructure.
The question is – what will happen to these precautionary balances when societies return back to normal, even if it may be a new normal. Hopefully, we will be wiser when assessing the global developments in a year’s time.
Trends in banknote circulation in value terms
Using statistics and various publications available on the central bank websites, altogether 141 currencies have been addressed. These include all but seven currencies where the respective central bank either does not have a website or it does not include any relevant information for the current purposes.
When addressing banknote demand globally, the most widely publicly available information is the value of banknotes in circulation. Again, to have as full review as possible it was necessary to use slightly different concepts. Besides ‘banknotes in circulation’ the only available figure in some cases was ‘banknotes and coins in circulation’ (coins are generally just a few percentages of the total cash in circulationThe value (or number of units) of the banknotes and coins in circulation within an economy. Cash in circulation is included in the M1 monetary aggregate and comprises only the banknotes and coins in circulation outside the Monetary Financial Institutions (MFI), as stated in the consolidated balance sheet of the MFIs, which means that the cash issued and held by the MFIs has been subtracted (“cash reserves”). Cash in circulation does not include the balance of the central bank’s own banknot... More figure) or ‘currency outside banks’. The latter concept is normally published as part of the monetary base, a monetary aggregate important to monetary policy.
Not including the banks ́ vaults, cash didn’t have in the past any significant impact on the calculation of the annual growth rate of the banknote circulation. More recently, after a few central banks introduced negative interest rates, vaultSafe; strong room. A place reinforced with special security measures where high-value objects and documents are safeguarded. In central banks, banknotes and other objects are safeguarded in vaults. More cash has increased exponentially in some currencies. So not including it would give a wrong impression on the demand for banknotes. However, in the current study the use of the concept ‘currency outside banks’ was limited to only five currencies.
The figures refer in most cases to the end of the year (in some cases the financial year is not the calendar year and the figures may refer to the end of the financial year). Let us first look at the annual growth rates of the value of banknotes in circulation in 2019, described in Figure 1, including information on 141 currencies.
The distribution is remarkably centred, with more than 75% of the currencies having an annual growth rate between 0 and 15%. There are a few outliers at both ends of the distribution including some currencies suffering from high inflation. The median growth rate in 2019 was 8%.
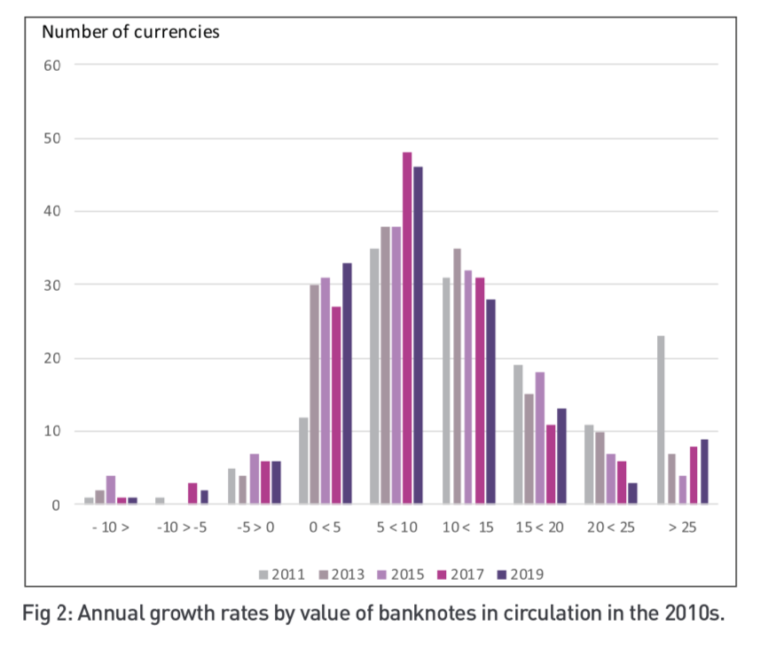
In order to get more perspective on the developments, the same information from the years 2011 (138 currencies), 2013, 2015 and 2017 (all 141 currencies) is included in Figure 2.
The first observation is that no major changes have happened in the growth rates of the value of banknotes in circulation during the 2010s. However, by closer look the situation in year 2011 will stick to the eye.
At the beginning of the decade more than 60% of the currencies had a double digit growth rate of the value of the banknotes in circulation, while at the end of the decade this was the case for 38% of currencies. This difference in the annual growth rates is confirmed by the development of the median annual growth rate during the 2010s, which is depicted in Figure 3.
The trend of the median annual growth rate has been slightly decreasing; however, there are ups and downs, eg. the median annual growth rate was almost the same in 2019 as it was in 2017 and 2015. Furthermore, the growth rates are globally higher than that of the nominal GDP. Three kinds of groups and developments can be identified in general terms.
The first group is formed of 38% (61% in 2011) of the currencies, in which the demand for banknotes in value terms was growing rapidly (double digit). Examples of currencies in this group can be found across all continents. Typically, the development in this group is driven by economic and population growth, and citizens having increased access to banking services.
However, only in a very few cases have the currencies had a double digit annual growth rate in each year in the 2010s. Normally, the decade also included years with lower economic growth, which was mirrored in the growth rate of the value of banknotes in circulation.
The second group includes those currencies in which the demand for banknotes is still increasing but by a single digit growth rate. This group includes in 2019 the majority, 56% of the currencies (34% in 2011). This second group includes the major currencies like the US dollarMonetary unit of the United States of America, and a number of other countries e.g. Australia, Canada and New Zealand. More, euroThe name of the European single currency adopted by the European Council at the meeting held in Madrid on 15-16 December 1995. See ECU. More, British pound, Swiss franc and also Chinese renminbi, irrespective of the high annual increases in the use of mobile payments.
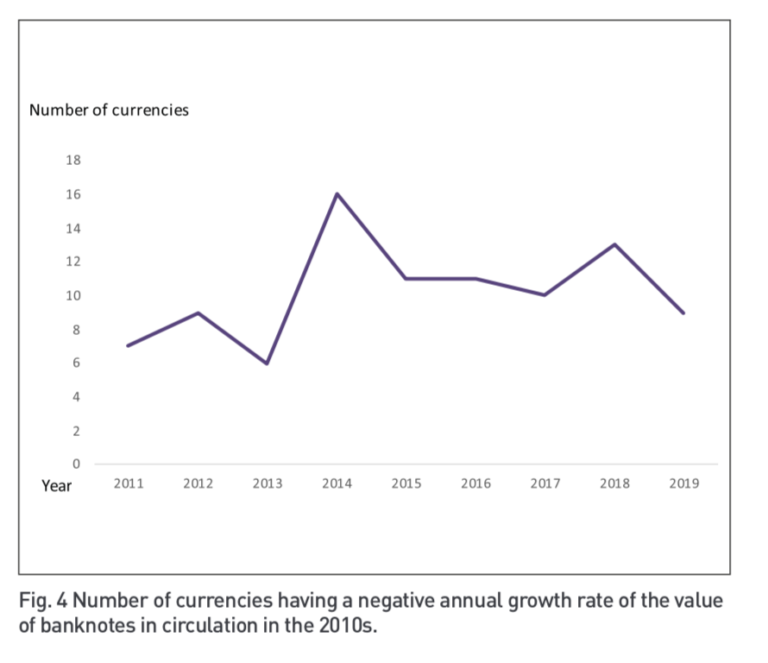
The third group consists of nine currencies in 2019 (seven in 2011) for which the demand for banknotes decreased in 2019 on an annual basis. Accordingly, even if in 2011 the median growth rate was more than four percentage points higher than in 2019, there was no major difference in the number of currencies having a negative growth rate. This number has fluctuated significantly during the 2010s, as can be seen in Figure 4, and no upward trend can be observed.
During the 2010s altogether more than 30% of the currencies have had at least one year with a negative annual growth rate. So in most cases the question is not of a ‘dash from cash’ trend but the annual growth rate has been negative because of an economic downturn or some other specific reason.
Only in the case of Swedish krona and Norwegian krone, both having seven years with negative annual growth rates in the 2010s, there has been a clear declining trend, even if in the former case the development has at least temporarily turned.
Current developments in banknote circulation in volume terms
It is evident that the development of the volume of banknotes in circulation is a more interesting pieceIn plural, it is commonly used as synonym for units of banknotes and coins. More of information to the banknote community than that of the value.
The volume development has more impact on the production, processing and logisticsThe term originates from military language and refers to the movement and provisioning of troops at war. In today’s business vocabulary, it refers to the management in particular, the transportation, storage and distribution of finished goods. More of banknotes, other things being equal, than that of the value. It also better accounts for the inflationary effects, which are mirrored in the value of banknotes
in circulation.
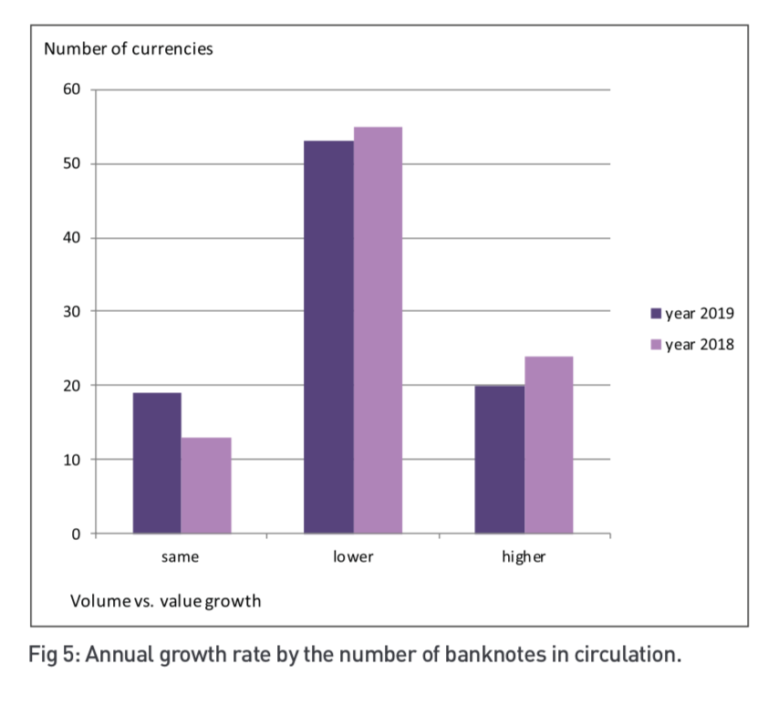
With the kind support of some central bank colleagues the annual growth rates of the number of banknotes in circulation was available for more than 90 currencies. Figure 5 addresses the distributions of these currencies in 2018 (93 currencies) and 2019 (92 currencies).
Evidently, the Figures 1 and 5 are not fully comparable, because the sample on which Figure 5 is based, is about 50 currencies smaller. However, a few interesting conclusions can be drawn on the basis of these figures.
First, the distributions are similar, the majority of the currencies having a single digit growth rate also in volume terms. The median annual volume growth of these currencies was 5.8% in 2019 (4.7% in 2018) in comparison to growth rates in value terms of 8% in 2019 (7% in 2018). This difference between the growth rates of the value and volume of banknotes in circulation is in line with expectations, with the growing banknote demand being partly explained by the store of valueOne of the functions of money or more generally of any asset that can be saved and exchanged at a later time without loss of its purchasing power. See also Precautionary Holdings. More function of banknotes, for which the higher denominations are used.
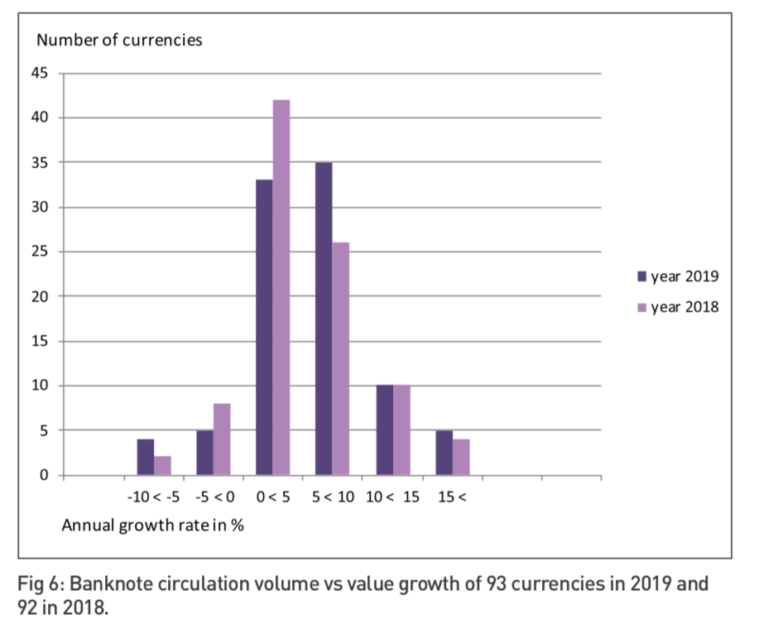
It is also interesting to compare the annual volume and value growths of these currencies. In this respect the currencies are divided in Figure 6 in three groups: 1) the annual volume and value growth rates are within a narrow range (15% – called the ‘same’), 2) the annual banknote volume growth is at least 15% lower than the value growth, and 3) the volume growth is at least 15% higher than the value growth.
On the basis of Figure 6, the great majority of the currencies had both in 2019 and 2018 a significantly lower volume growth than the value growth. This is in line with the indication above, that the role of the store of value function of banknotes has increased simultaneously when the share of banknote transactions has decreased.
Conclusions
Several conclusions can be drawn from recent developments in banknote circulation. After the outbreak of the COVID-19 pandemic the precautionary demand for banknotes has increased generally, with rates that have not been experienced during the entire last decade. Time will show what will happen to these precautionary balances when societies return back to normal.
The trend of the median annual growth rate of the value of banknotes in circulation is slightly decreasing. However, there are ups and downs and the median growth rate was almost the same in 2019 as in 2017 and 2015. Furthermore, the growth rates are globally higher than that of the nominal GDP. In addition, only a couple of currencies have a decreasing trend of the value of banknotes in circulation.
As regards the banknote volumes in circulation, they are in general growing more slowly than the values. This points to the increasing role of the store of value function of banknotes, which has been also mirrored in the public behaviour after the outbreak of COVID-19 pandemic. This development highlights the role of cash as a public infrastructure, and the importance of the access to and acceptance of cash during normal times.
You cannot have cash as a fall back in a crisis if the infrastructure is not regularly used and available. Should market forces no longer guarantee the existence of a functioning cash infrastructure, central banks should consider ensuring the access to and acceptance of cash by regulation or subsidies, as well as more proactively promoting confidence in cash payments.


