Demand for Cash Under Uncertainty: A Global Update for 2023
This post is also available in:
![]()
CurrencyThe money used in a particular country at a particular time, like dollar, yen, euro, etc., consisting of banknotes and coins, that does not require endorsement as a medium of exchange. More News™ has published Antti Heinonen’s annual updates on banknoteA banknote (or ‘bill’ as it is often referred to in the US) is a type of negotiable promissory note, issued by a bank or other licensed authority, payable to the bearer on demand. More developments at the global level since September 2017. This article is based on a presentation at the 6th International CashMoney in physical form such as banknotes and coins. More Conference organized by the Deutsche Bundesbank, which took place 12−14 September in Bad Homburg, Germany.
So called ‘normal times’ ended in many respects more than three years ago, in early 2020. Since then, developments have been characterised by growing uncertainty and volatility, first by the COVID-19 pandemic and disruption of global supply chains, and then by geopolitical tensions created by the Russian attack on Ukraine and inflation of food and energy prices.
Besides several other consequences, these events have had a great impact on the use and demand for cash. Nothing indicates that such developments will stabilise in the near future, not to speak of climate changeThis is the action by which certain banknotes and/or coins are exchanged for the same amount in banknotes/coins of a different face value, or unit value. See Exchange. More. These uncertainties mirror the current global update.
In order to get a perspective, this update will start with an analysis of the development of banknote circulation in value terms during the 2010s, which will be compared with the situation in more recent years, and in particular in 2022. After that, developments in banknote volume terms are studied and finally, before concluding, the most recent developments are addressed by considering the annual growth rates of the value of banknotes in circulation in June 2023.
Banknote circulation in value terms
In the course of these annual updates one of the objectives has been to continuously improve the consistency of the data.
In earlier years, the best indicator on banknote circulation found in a few instances has been ‘currency outside banks’, a monetary aggregate followed by the central banks, which excludes the banks´ vaultSafe; strong room. A place reinforced with special security measures where high-value objects and documents are safeguarded. In central banks, banknotes and other objects are safeguarded in vaults. More cash.
However, in the current update the use of this concept has been avoided. The only remaining inconsistency is the use of ‘cash’ instead of ‘banknotes’ in circulation, ie. the figures include besides banknotes also coins in case of around 10% of the currencies. However, coins are generally just a few percentages of the total cash in circulationThe value (or number of units) of the banknotes and coins in circulation within an economy. Cash in circulation is included in the M1 monetary aggregate and comprises only the banknotes and coins in circulation outside the Monetary Financial Institutions (MFI), as stated in the consolidated balance sheet of the MFIs, which means that the cash issued and held by the MFIs has been subtracted (“cash reserves”). Cash in circulation does not include the balance of the central bank’s own banknot... More, so the impact of using slightly differing concepts will have only a minor, if any, impact on the results of this study.
The reason that these updates focus mainly on the demand for banknotes, instead of consistently including coins as well in the figures, is that then the comparison of the value and volume figures would lose all sense. Even if coins are only a few percentages of the value of cash, they represent in most cases the great majority in volume terms.
Using statistics and various publications available on central bank websites, a slightly varying number (between 137 and 143) of currencies have been addressed in the following three charts. The figures refer in almost all cases to the end of the year. In a very few instances the figures refer to the end of the financial year deviating from the calendar year. Furthermore, a couple of central banks haven’t yet published the figures at the end of 2022 and therefore, the annual growth rates refer to the end of an earlier month in 2022.
Let us first look at the developments in still ‘normal’ years during the 2010s. Figure 1 illustrates the distributions of the annual growth rates by value of banknotes in circulation in the years 2011, 2013, 2015, 2017 and 2019.
The distributions in various years are fairly similar to each other and resemble normal distributions. They are centred in the 5−10 % annual growth rate bracket, and both negative and very high positive rates are exceptional (only the year 2011 deviates in the latter respect).

Fig 1: Annual growth rates by value of banknotes in circulation during the last decade
The developments during the last three years are studied against this background in Figure 2.
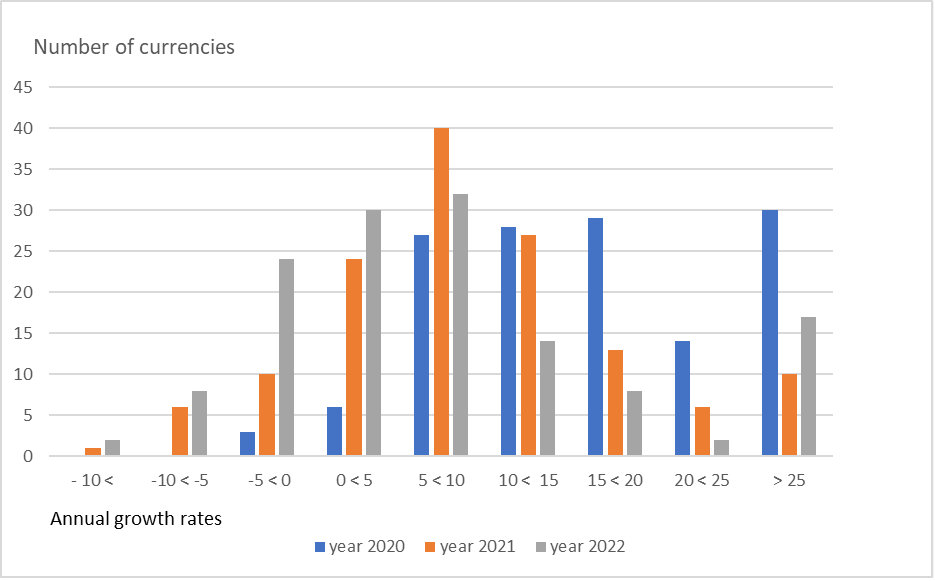
Fig. 2: Annual growth rates by value of banknotes in circulation in 2020, 2021 and 2022 (137 currencies)
The pandemic year 2020 sticks out in Figure 2. It can be characterised as the climax of the paradoxical development of the two motives to use cash. While the transactional use of cash was limited because of various restrictions, the precautionary demand reached record growth rates.
The distribution in 2021 is similar to that during the 2010s, indicating a step towards normality, and the higher-than-normal cash balances accumulated during the pandemic were not abandoned.
The public’s behaviour changed in this respect in 2022. Even if the uncertainties continued and still justified the precautionary demand for cash, its growing opportunity cost because of high inflation and increasing interest rates motivated the public to reduce their cash balances. According to Figure 2 almost 25% of the currencies had a negative growth rate by value of banknotes in circulation in 2022.
Even if cash holdings were decreased to this extent, there were a growing number of currencies having a growth rate by the value of banknotes in circulation of more than 25%. They were mainly currencies of high inflation countries. (See also Gerhard Rösl & Franz Seitz, Uncertainty, Politics, and Crises: The Case for Cash. Institute for Monetary and Financial Stability, Goethe University Frankfurt, Working Papers No. 186 (2023).)
The developments can be further highlighted by Figure 3 depicting the median annual growth rates by value of banknotes in circulation since 2012.
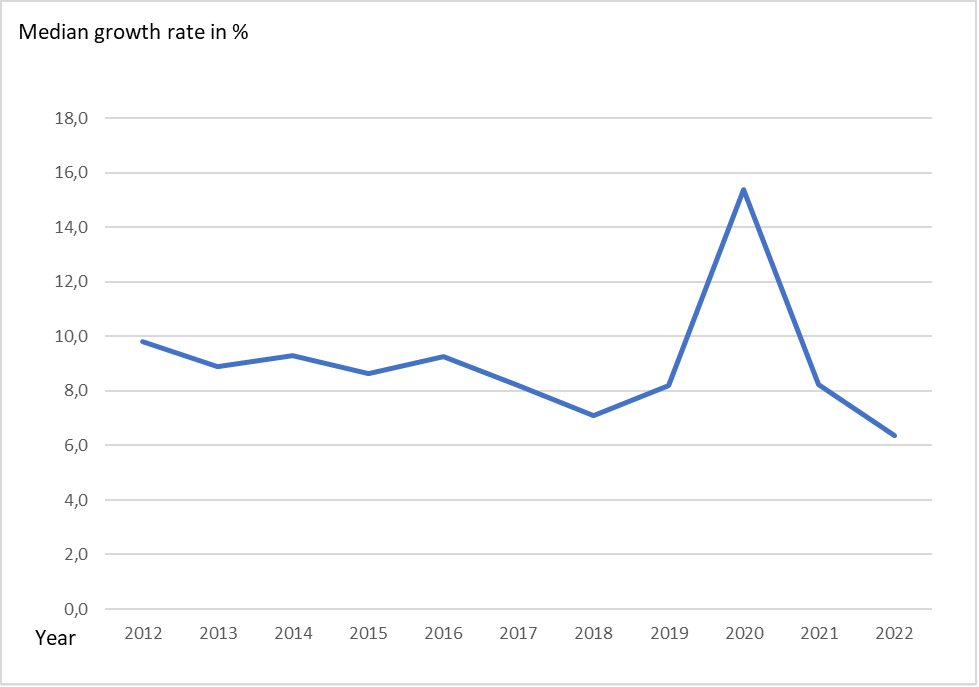
Fig 3: The median annual growth rates by value of banknotes in circulation since 2012
The trend of the median annual growth rate has had a slightly decreasing trend with small ups and downs. The year 2020 makes a striking exception in this development. It is remarkable that, even after such an exceptional year, the median annual growth rate by value of banknotes in circulation has not fallen close to zero or reached even a negative figure, but has kept the trend it had before the pandemic.
Banknote circulation in volume terms
Even if most studies related to banknote circulation analyse the development in value terms, it is the volume development which has the biggest impact on the activities of the various stakeholders in the cash cycleRepresents the various stages of the lifecycle of cash, from issuance by the central bank, circulation in the economy, to destruction by the central bank. More. The development of the two indicators has deviated, in particular, recently because the demand for banknotes for transactions (small and medium denominations) and for savings and precautionary purposes (high denominations) have evolved differently.
Unfortunately, denominational data on banknote circulation has much less coverage on central bank websites than the total value of circulation. Furthermore, when available, it is published in many cases with a longer delay than the value data.
With the generous support of several central bank colleagues, the publicly available data has been complemented with a number of additional currencies. Accordingly, the annual growth rates of the number of banknotes in circulation was available in 2022 for 100 currencies (in comparison to 137 currencies in value terms). Figure 4 addresses the distributions of these 100 currencies by the number of banknotes in circulation in 2020, 2021 and 2022.
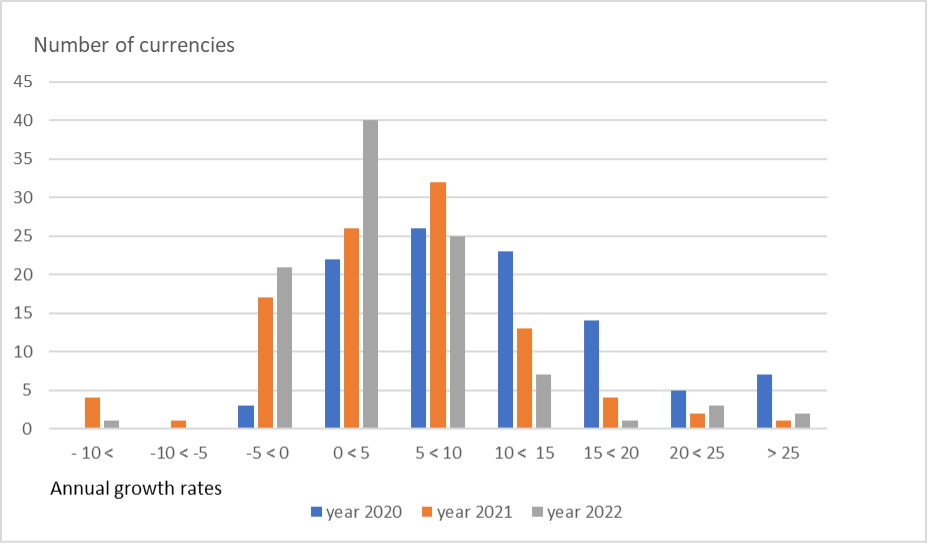
Fig 4: Annual growth rate by the number of banknotes in circulation of 100 currencies in 2020, 2021 and 2022.
Even if the shapes of the distributions in the three years show some similarity, the distribution in 2022 continued the shift further to the left towards negative growth rates, which had occurred already in 2021.
The number of currencies in the sample having a negative growth rate remained the same in 2022 as in 2021, but the negative growth rates were more moderate. It indicates that the reduction of cash balances in 2022 has more than proportionally fallen upon the high denominations.
This is confirmed by Figure 5, in which the growth rates by both value and volume terms in 2022 are compared. The study is again limited to those 100 currencies, for which both figures are available.
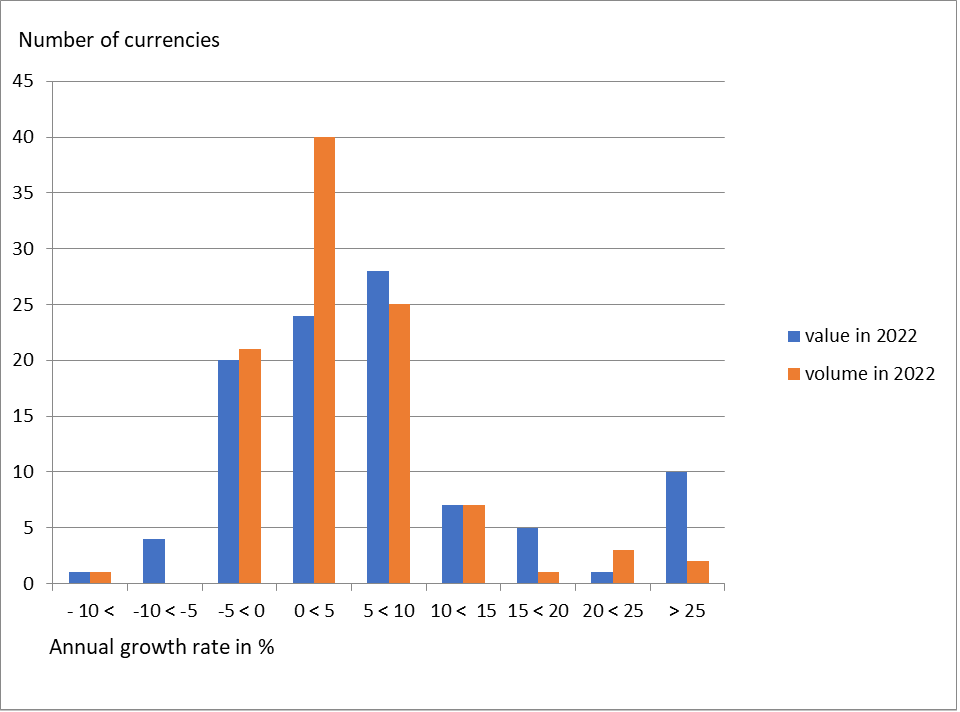
Fig 5: Annual growth rates by the value and number of banknotes in circulation of 100 currencies in 2022
The distributions are surprisingly similar within this sample of currencies. On both dates the growth rates were between -5 and +10 in case of close to 60% of the currencies and almost the same amount of currencies were in these three brackets.
The number of currencies that experienced negative annual growth rates has been recently higher than before the pandemic, but in June 2023 there was no significant change in relation to the situation one year earlier. Even if cash balances were decreasing in case of several currencies, around 75% of the currencies in the sample had positive annual growth rates.
Concluding remarks
There are evidently various purely economic and behavioural variables which have an impact on the demand for cash. Even if the paymentA transfer of funds which discharges an obligation on the part of a payer vis-à-vis a payee. More behaviour of the general public changed during the pandemic, exceptional cash balances were accumulated, in particular in high denominationEach individual value in a series of banknotes or coins. More banknotes.
The behaviour followed the practice in similar earlier situations of global uncertainty as in anticipation of technological challenges of the millennium or mistrust in the banking system during the financial crisis in 2008.
Even if the pandemic slowed down, the accumulated cash balances were not abandoned in 2021, because of the continuing uncertainty. This occurred first in 2022, when in an environment of growing interest rates and prices the opportunity cost of holding cash rose significantly. Also, the decreasing real income of citizens evidently motivated them to use of part of their cash savings for consumption in 2022.
World inflation, which was 2.9% in 2020, increased to 8.9 % in 2022, and is projected to decrease to 3.6% only in 2025 (IMF Economic Outlook April 2023). It will therefore take time before inflation will reach levels which will have no negative impact on savings in cash.
On the other side of the scales, however, are the great uncertainties created by the Russian attack on Ukraine and the geopolitical tensions brought about, as well as the growing frequency of extreme weather phenomena and the vulnerability of electronic systems. They all justify the precautionary motive to hold higher than normal cash balances.
Regarding the payment landscape, the majority of central banks are currently focused on the development of central bank digital currency (CBDC)A digital payment instrument, denominated in the national unit of account, and a direct liability of the central bank, like banknotes. A general purpose CBDC can be used by the public for day-to-day payments like cash. More. There are important reasons for that work, but central banks shouldn’t put all their stakes in it.
The trust in physical cash has been evidenced regularly during global uncertainties, whatever their reason. There is a question mark whether this trust in physical cash can be transferred into a digital currency. Therefore, continuous innovation is also needed in the maintenance and development of the cash infrastructure in the rapidly changing environment.
This post is also available in:
![]()