Development of Banknotes in Circulation Since 1998, and By Regions
Previous annual updates on the global demand for banknotes have focused-d mainly on the most recent trends. By contrast, this article addresses the development of global note demand during a period covering close to three decades.
In addition, this article also illustrates another interesting theme, namely the development of global demand by region. It is commonly noticed that there are two types of developments currently: currencies, that have a decreasing trend in the annual growth rates by notes in circulation, but also currencies, which have consistently high annual growth rates. Further light will be shed on this phenomenon by illustrating the development with four regional charts. Finally, before concluding, the volume development in 1998−2024 will be addressed.
Global banknote circulation in value terms in 1998−2025
When studying the development of global banknoteA banknote (or ‘bill’ as it is often referred to in the US) is a type of negotiable promissory note, issued by a bank or other licensed authority, payable to the bearer on demand. More demand since 1998, the annual median growth rate of note circulation is used as the indicator. Median growth rate is more descriptive than, e.g. average growth rate because of hyperinflation of some currencies distorts the analysis.
Optimally, all figures would be based on banknote circulation, but consistent values are not available for all currencies in view of the long period. In some cases, the only available figure is cash in circulationThe value (or number of units) of the banknotes and coins in circulation within an economy. Cash in circulation is included in the M1 monetary aggregate and comprises only the banknotes and coins in circulation outside the Monetary Financial Institutions (MFI), as stated in the consolidated balance sheet of the MFIs, which means that the cash issued and held by the MFIs has been subtracted (“cash reserves”). Cash in circulation does not include the balance of the central bank’s own banknotes (as... More or cashMoney in physical form such as banknotes and coins. More/banknotes in the hands of public, not including the bank vaultSafe; strong room. A place reinforced with special security measures where high-value objects and documents are safeguarded. In central banks, banknotes and other objects are safeguarded in vaults. More cash. However, this minor inconsistency doesn’t have an impact on the results, because coins are mostly only a few percents and rarely above 10% of the cash in circulation.
Regarding the bank vault cash, there have been major changes in the bank behaviour only during and after the period of zero interest rates, and during those years the data are consistently including bank vault cash as well.
To include as comprehensive information as possible, banknote circulation in value terms 1998−2025 is studied using data from a slightly varying number (between 143 and 149) of currencies. Data is missing only for half a dozen of currencies.
Figure 1 describes the annual median growth rate by value of banknotes in circulation. The data refer to the end of the calendar year with a couple of exceptions, even in cases where the financial year of the respective central bank is not the calendar year.
Fig 1: Annual median growth rate by value of banknotes in circulation in 1998−2025 (on average 147 currencies).
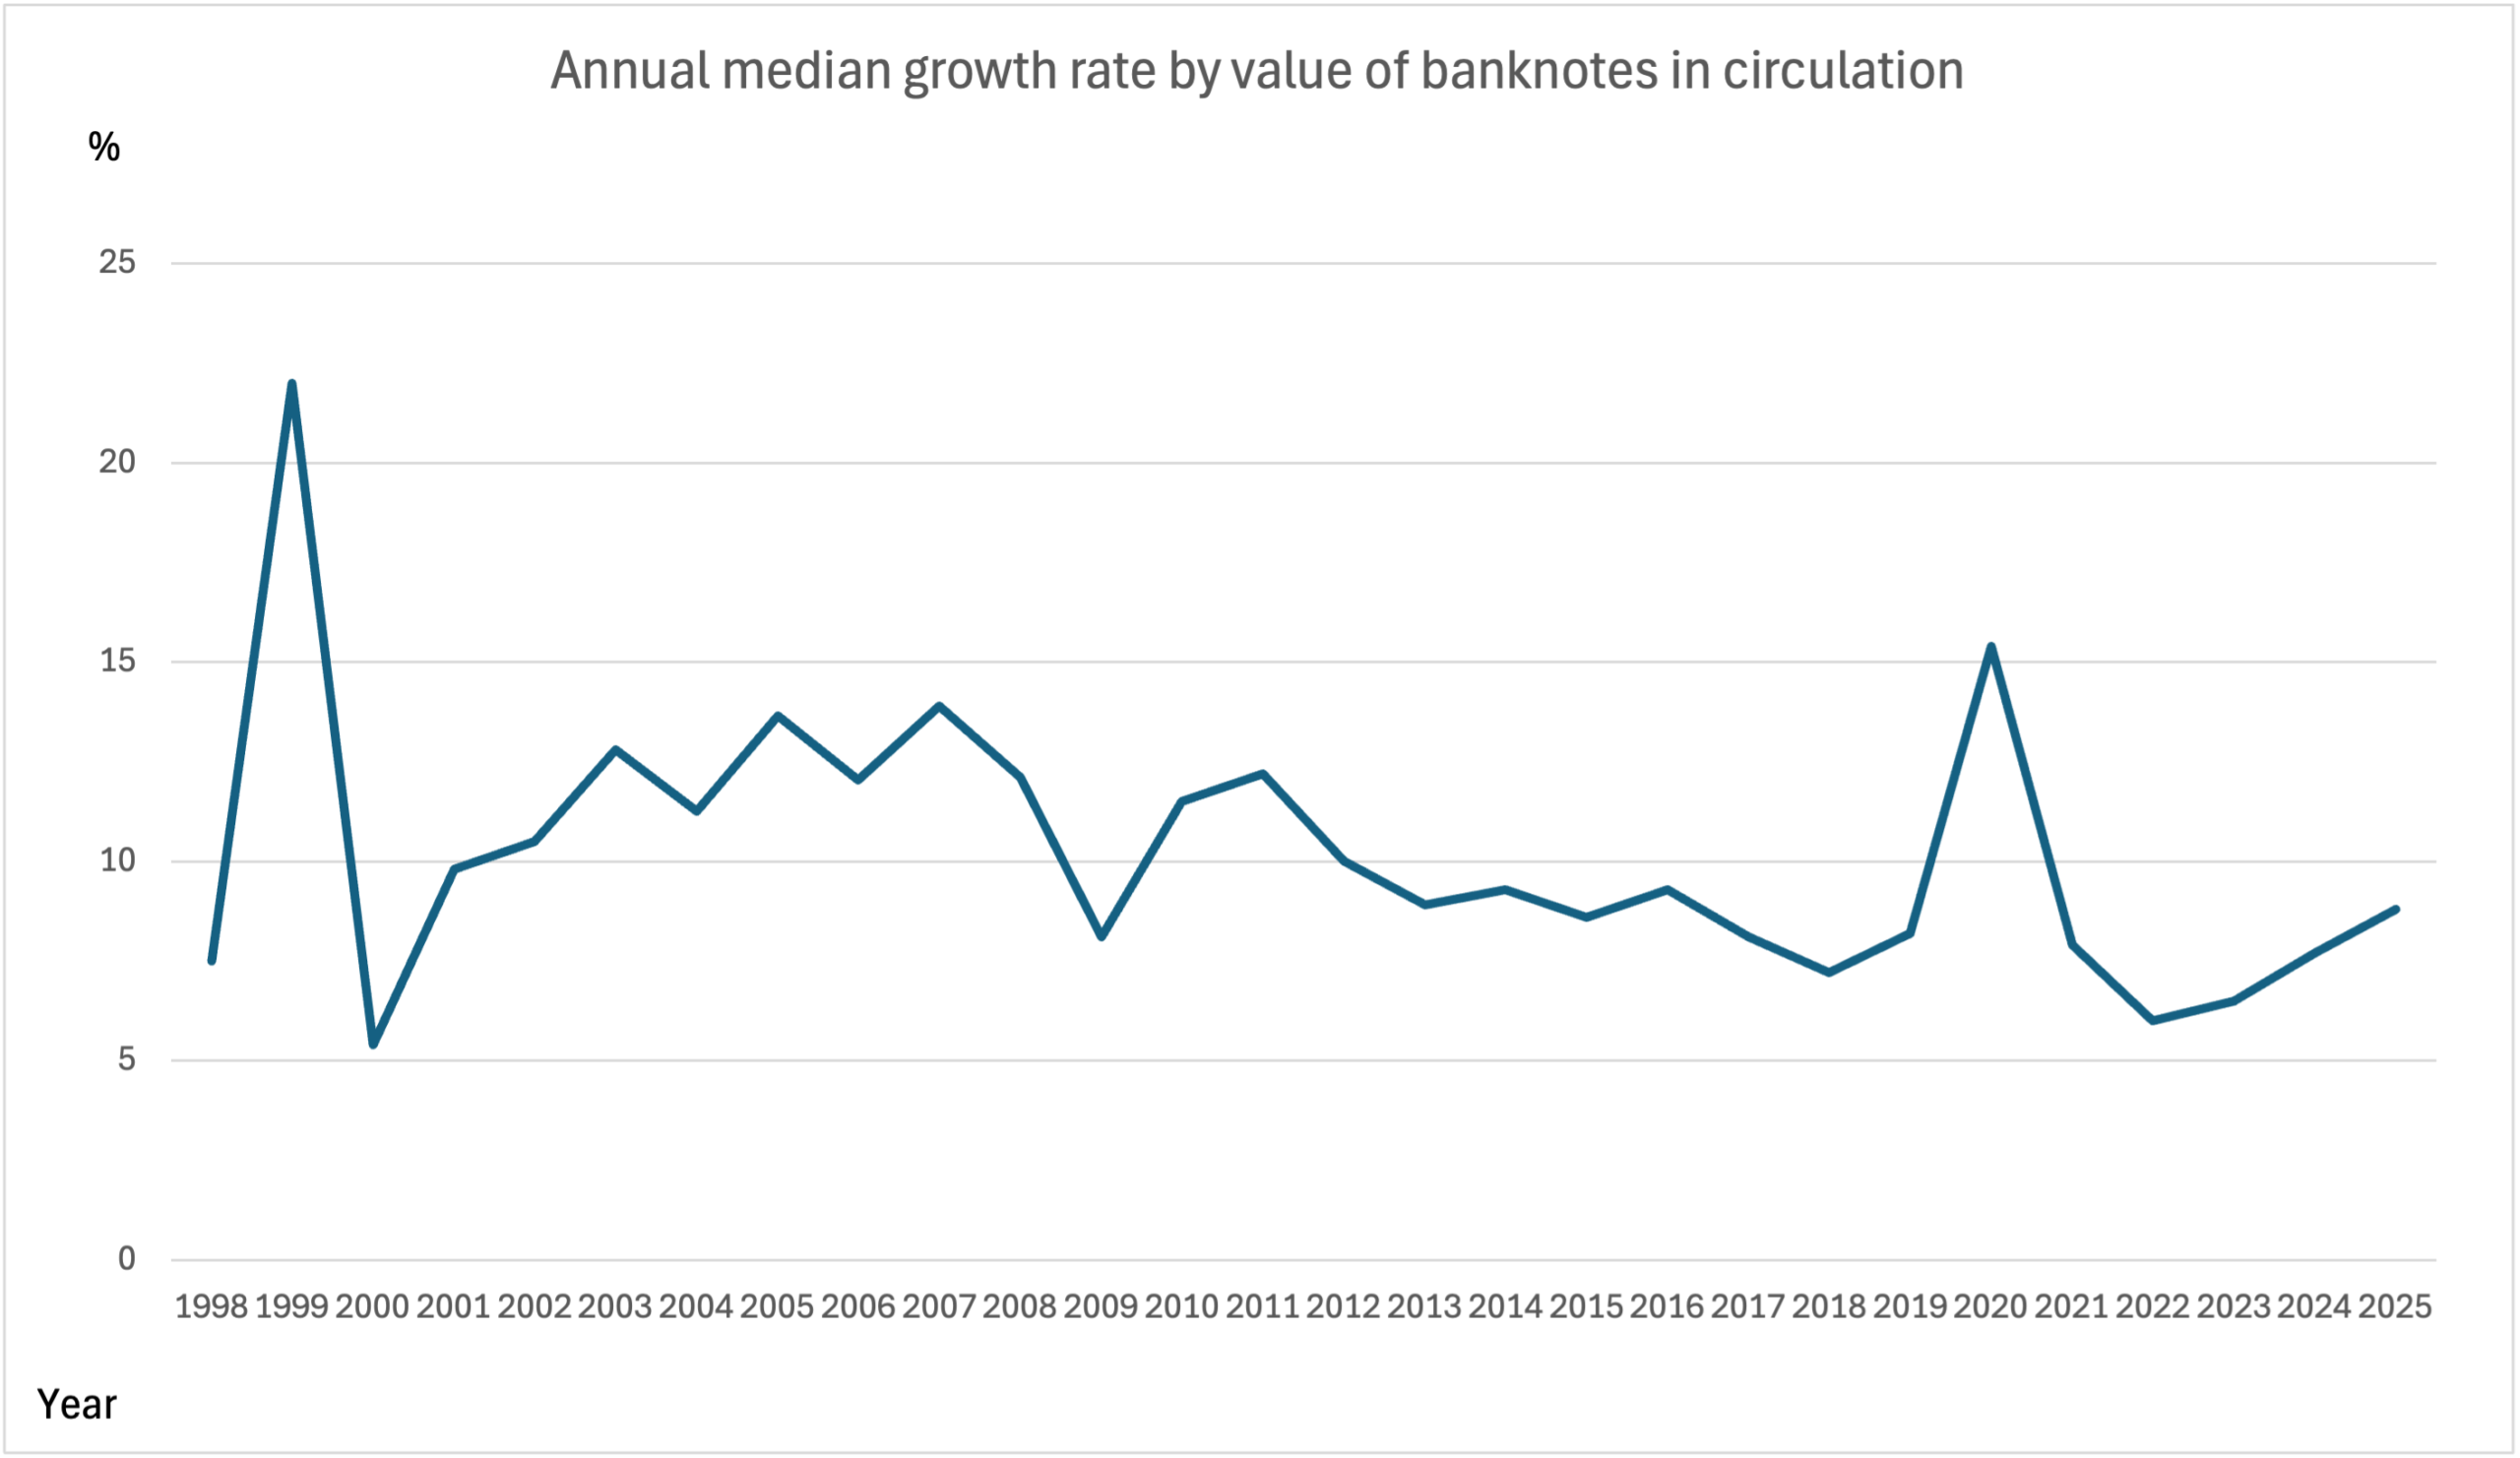
Figure 1 highlights several interesting aspects. The most striking characteristic is the strong reflection of major global uncertainties (the Y2K, financial crisis and COVID-19) on the median growth rate. By contrast, the year succeeding the uncertainty always witnessed a substantial decrease in the median growth rate since the public have widely abandoned the extra cash balances. This development shows clearly that banknotes are used besides paymentA transfer of funds which discharges an obligation on the part of a payer vis-à-vis a payee. More media as a store of valueOne of the functions of money or more generally of any asset that can be saved and exchanged at a later time without loss of its purchasing power. See also Precautionary Holdings. More for precautionary purposes, because extra cash holdings have been kept only temporarily during the uncertainties.
Figure 1 shows also that after the extra cash balances acquired at the end of 1999 had been deposited back into bank accounts, the value of banknotes in circulation enjoyed a long period of high annual median growth rates, which were consistently over 10%. The aftermath of the financial crisis temporarily disturbed this development, and during 2012 began a decreasing trend of annual median growth rates until the pandemic radically changed the curve.
Because the lockdowns and travel restrictions caused by the pandemic increased online shopping and use of contactless and mobile payments, one could have imagined that this would have had a permanent impact on cash holdings. Particularly, when an erroneous perception emerged that cash had a role in spreading the virus and bans and recommendations to avoid cash turned up in shops and are still employed.
However, after the release of extra cash holdings built up during the pandemic, the median growth rate has again begun to increase during the last three years (the 2025 figures are still provisional, because not all of them are related to the end of the year).
A similar study is now presented by comparing the regional versus global development.
Global banknote circulation in value terms in 1998−2025 by regions
The global banknote circulation is in the following divided into four regions (Asia, Middle East and Oceania are merged for statistical reasons). The regions are in order 1) Africa, 2) Americas, 3) Asia, Middle East and Oceania and 4) Europe, and will be addressed accordingly.
Figure 2 compares the annual median growth rate by value of banknotes in circulation in Africa vs globally.
Fig 2: Annual median growth rate by value of banknotes in circulation in 1998−2025 in Africa vs globally
(on average 39 and 147 currencies respectively).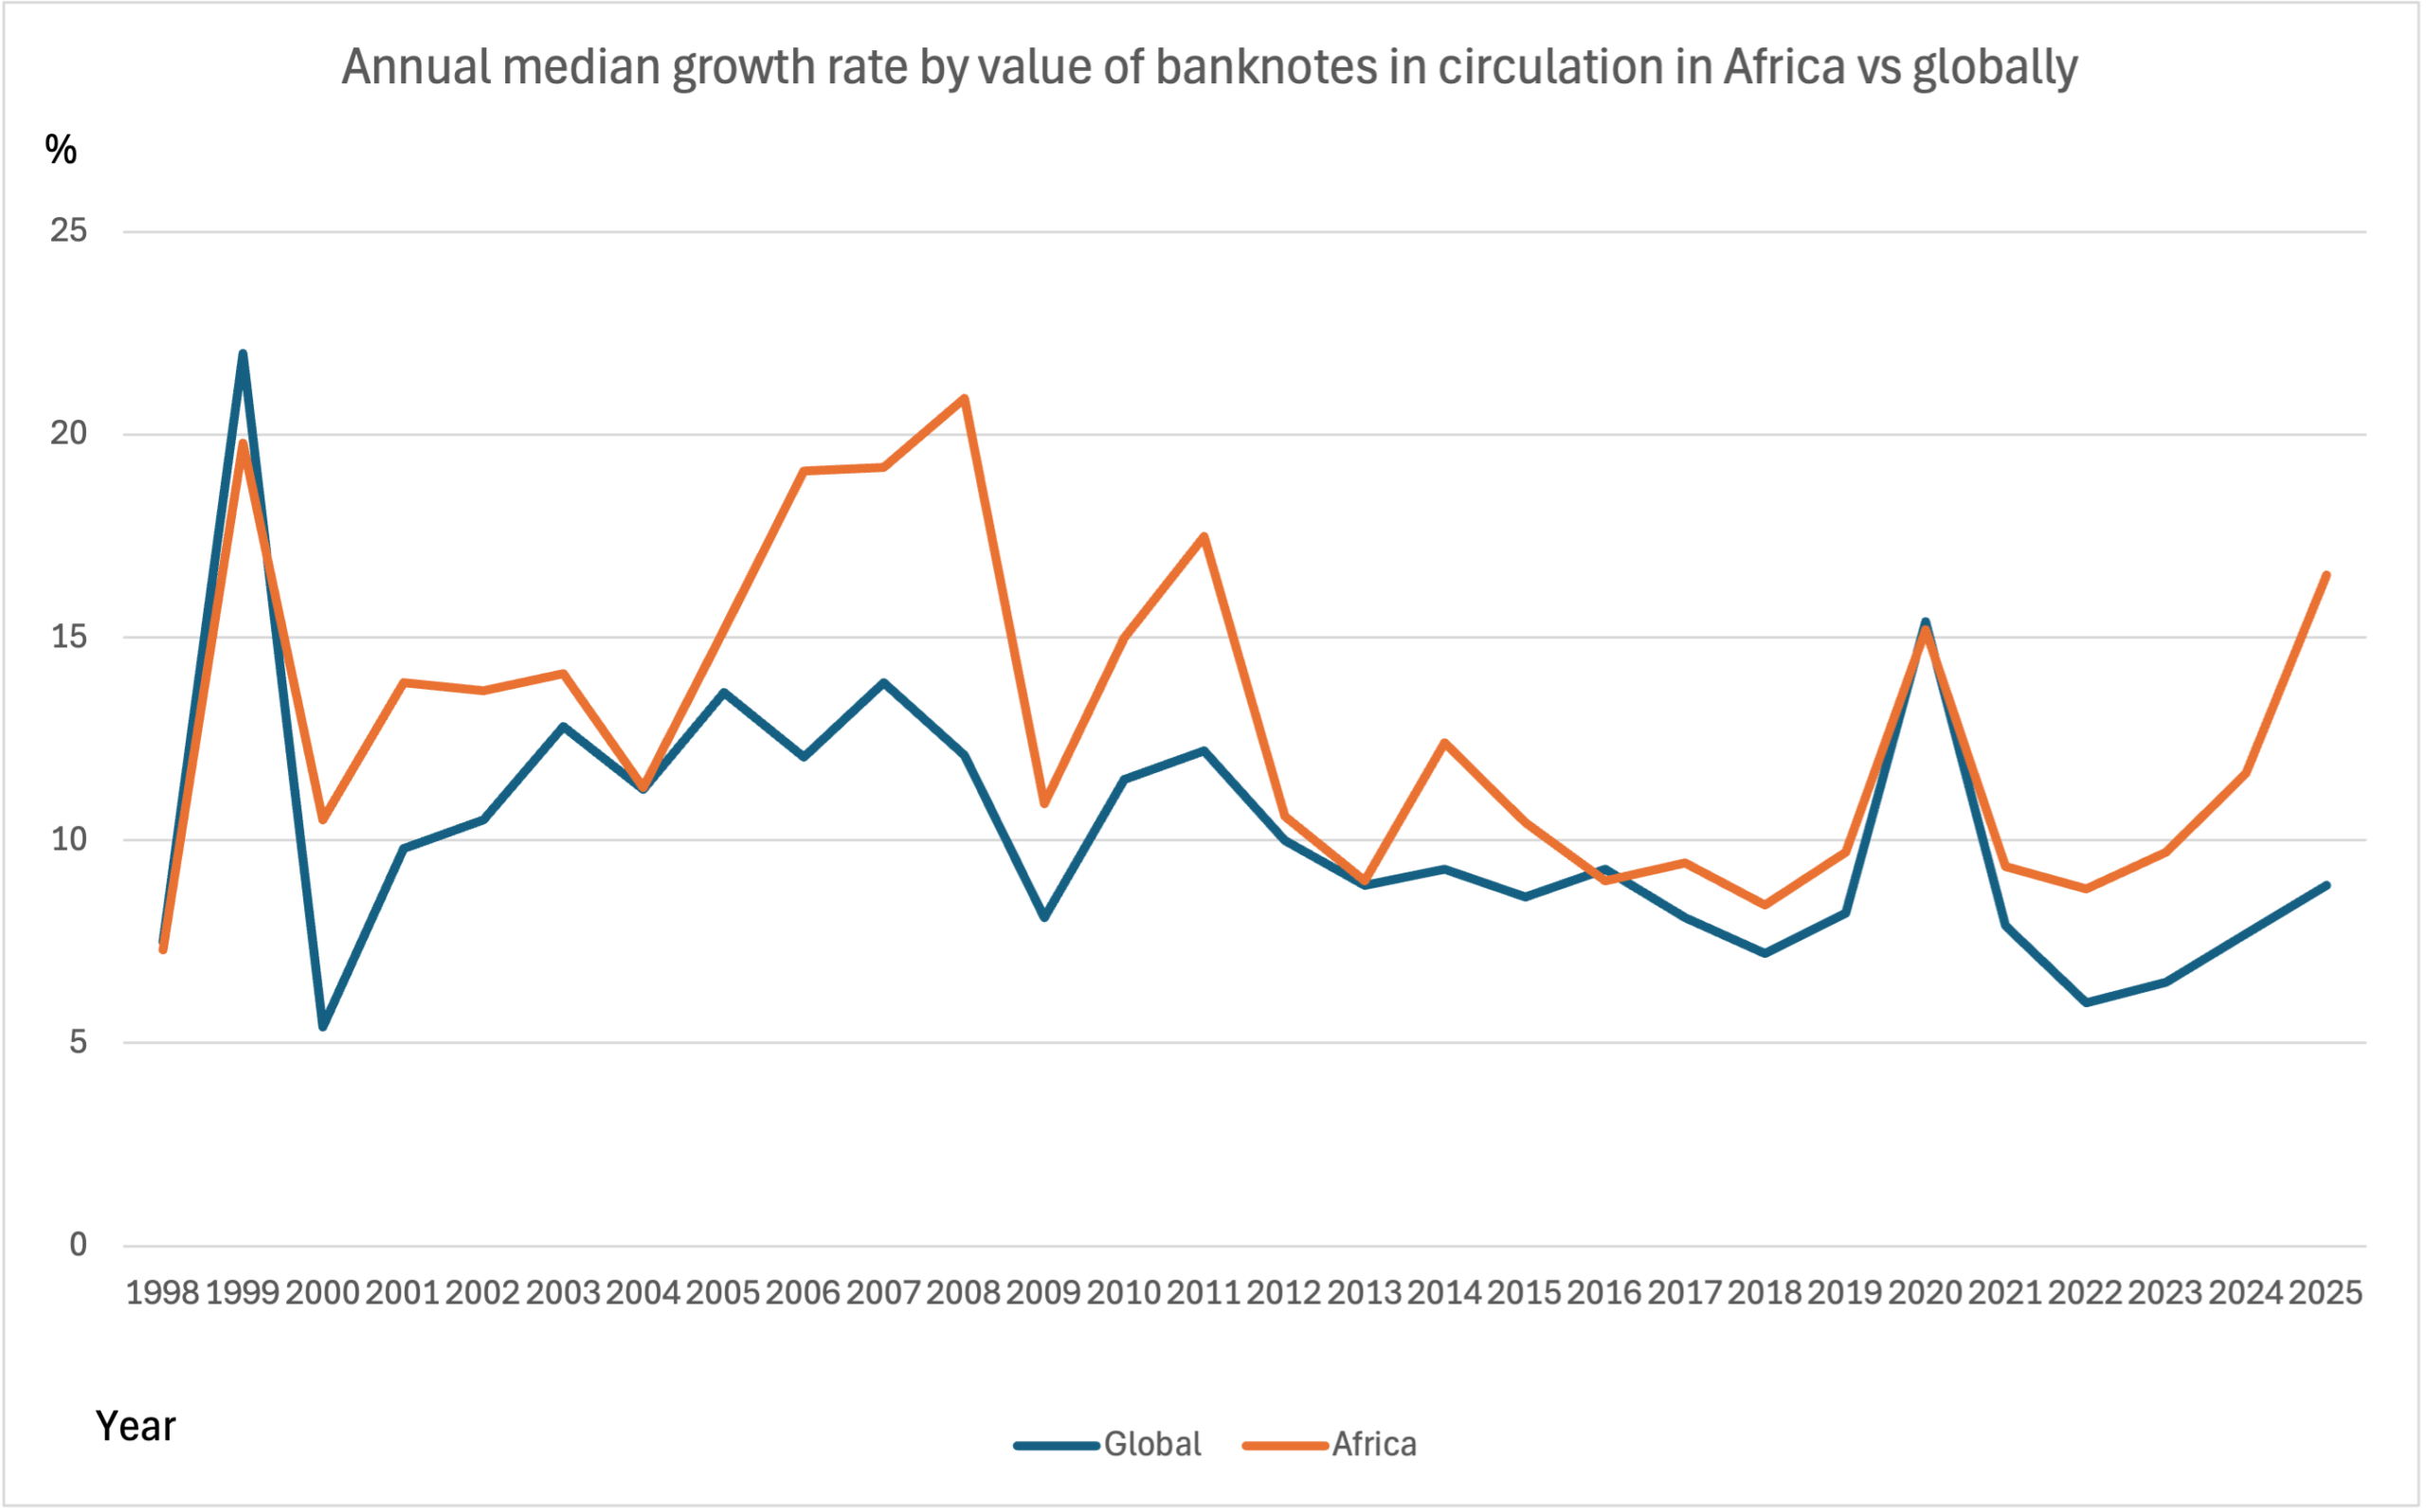
The first regional chart illustrates elegantly the fact that there is a whole continent in which the demand for banknotes measured by the annual median growth rate of notes in circulation is consistently very high. With a few exceptions, the growth rates are more than 10% during the whole period subject to this study.
During Y2K and COVID-19 the development in Africa didn’t deviate from the global norm, only the reaction afterwards was more modest. However, during the financial crisis the precautionary demand was much more significant than globally.
Quire surprisingly, the median growth rate at the end of 2025 is even higher than during the peak of COVID-19, though the 2025 figures are still provisional. However, the final figures might only slightly changeThis is the action by which certain banknotes and/or coins are exchanged for the same amount in banknotes/coins of a different face value, or unit value. See Exchange. More the impression.
Next follows a similar study regarding the Americas vs globally.
Fig 3: Annual median growth rate by value of banknotes in circulation in 1998−2025 in Americas vs globally
(30 and on average 147 currencies respectively).
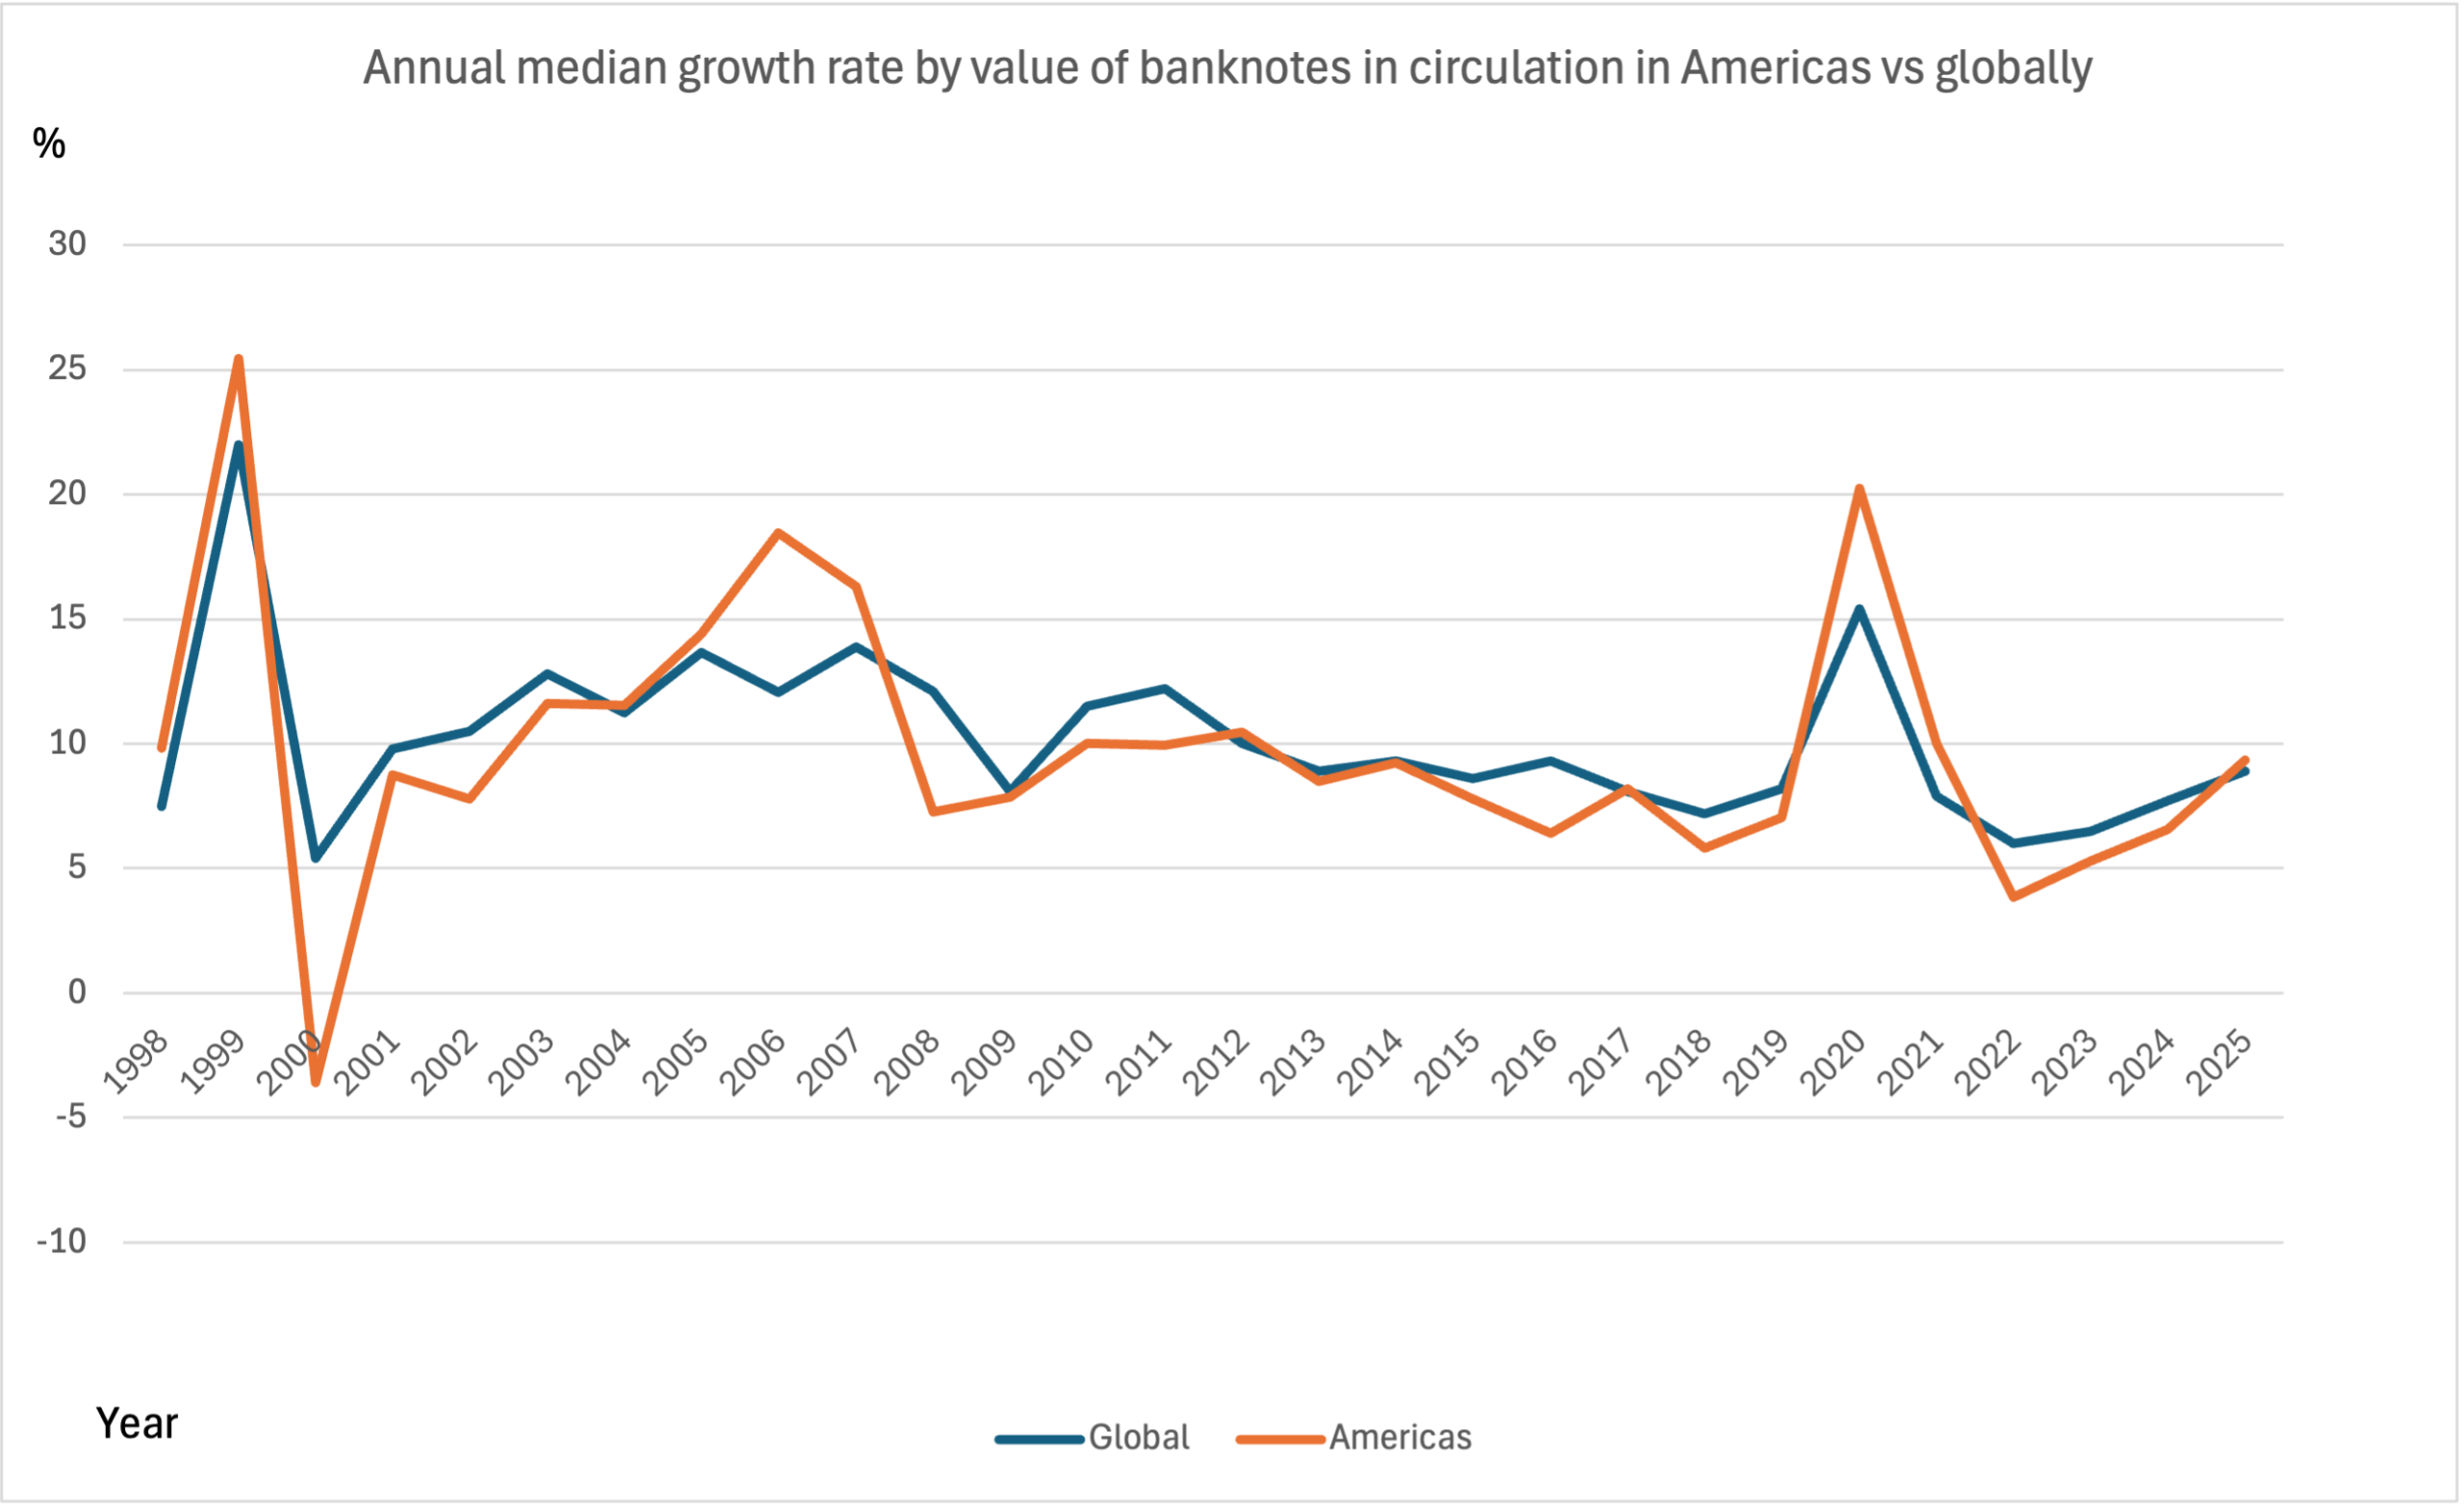
Figure 2 highlighted almost consistently higher median growth rates than globally. Figure 3 is in that respect less spectacular. Based on the annual median growth rate by value of notes in circulation, the development in Americas follows mostly the global development. Only the precautionary demand during and after the great uncertainties is more volatile than globally.
Particularly, after the Y2K fears, in 2000 more than half of the currencies had a negative growth rate in the Americas. However, the demand during the financial crisis in 2008 was contrary to the global development, which may be explained by the use of US dollarMonetary unit of the United States of America, and a number of other countries e.g. Australia, Canada and New Zealand. More as a default currencyThe money used in a particular country at a particular time, like dollar, yen, euro, etc., consisting of banknotes and coins, that does not require endorsement as a medium of exchange. More in Latin America.
The development in the region comprising Asia, Middle East and Oceania is addressed in Figure 4.
Fig 4: Annual median growth rate by value of banknotes in circulation in 1998−2025 in Asia, Middle East and Oceania vs globally
(on average 54 and 147 currencies respectively).
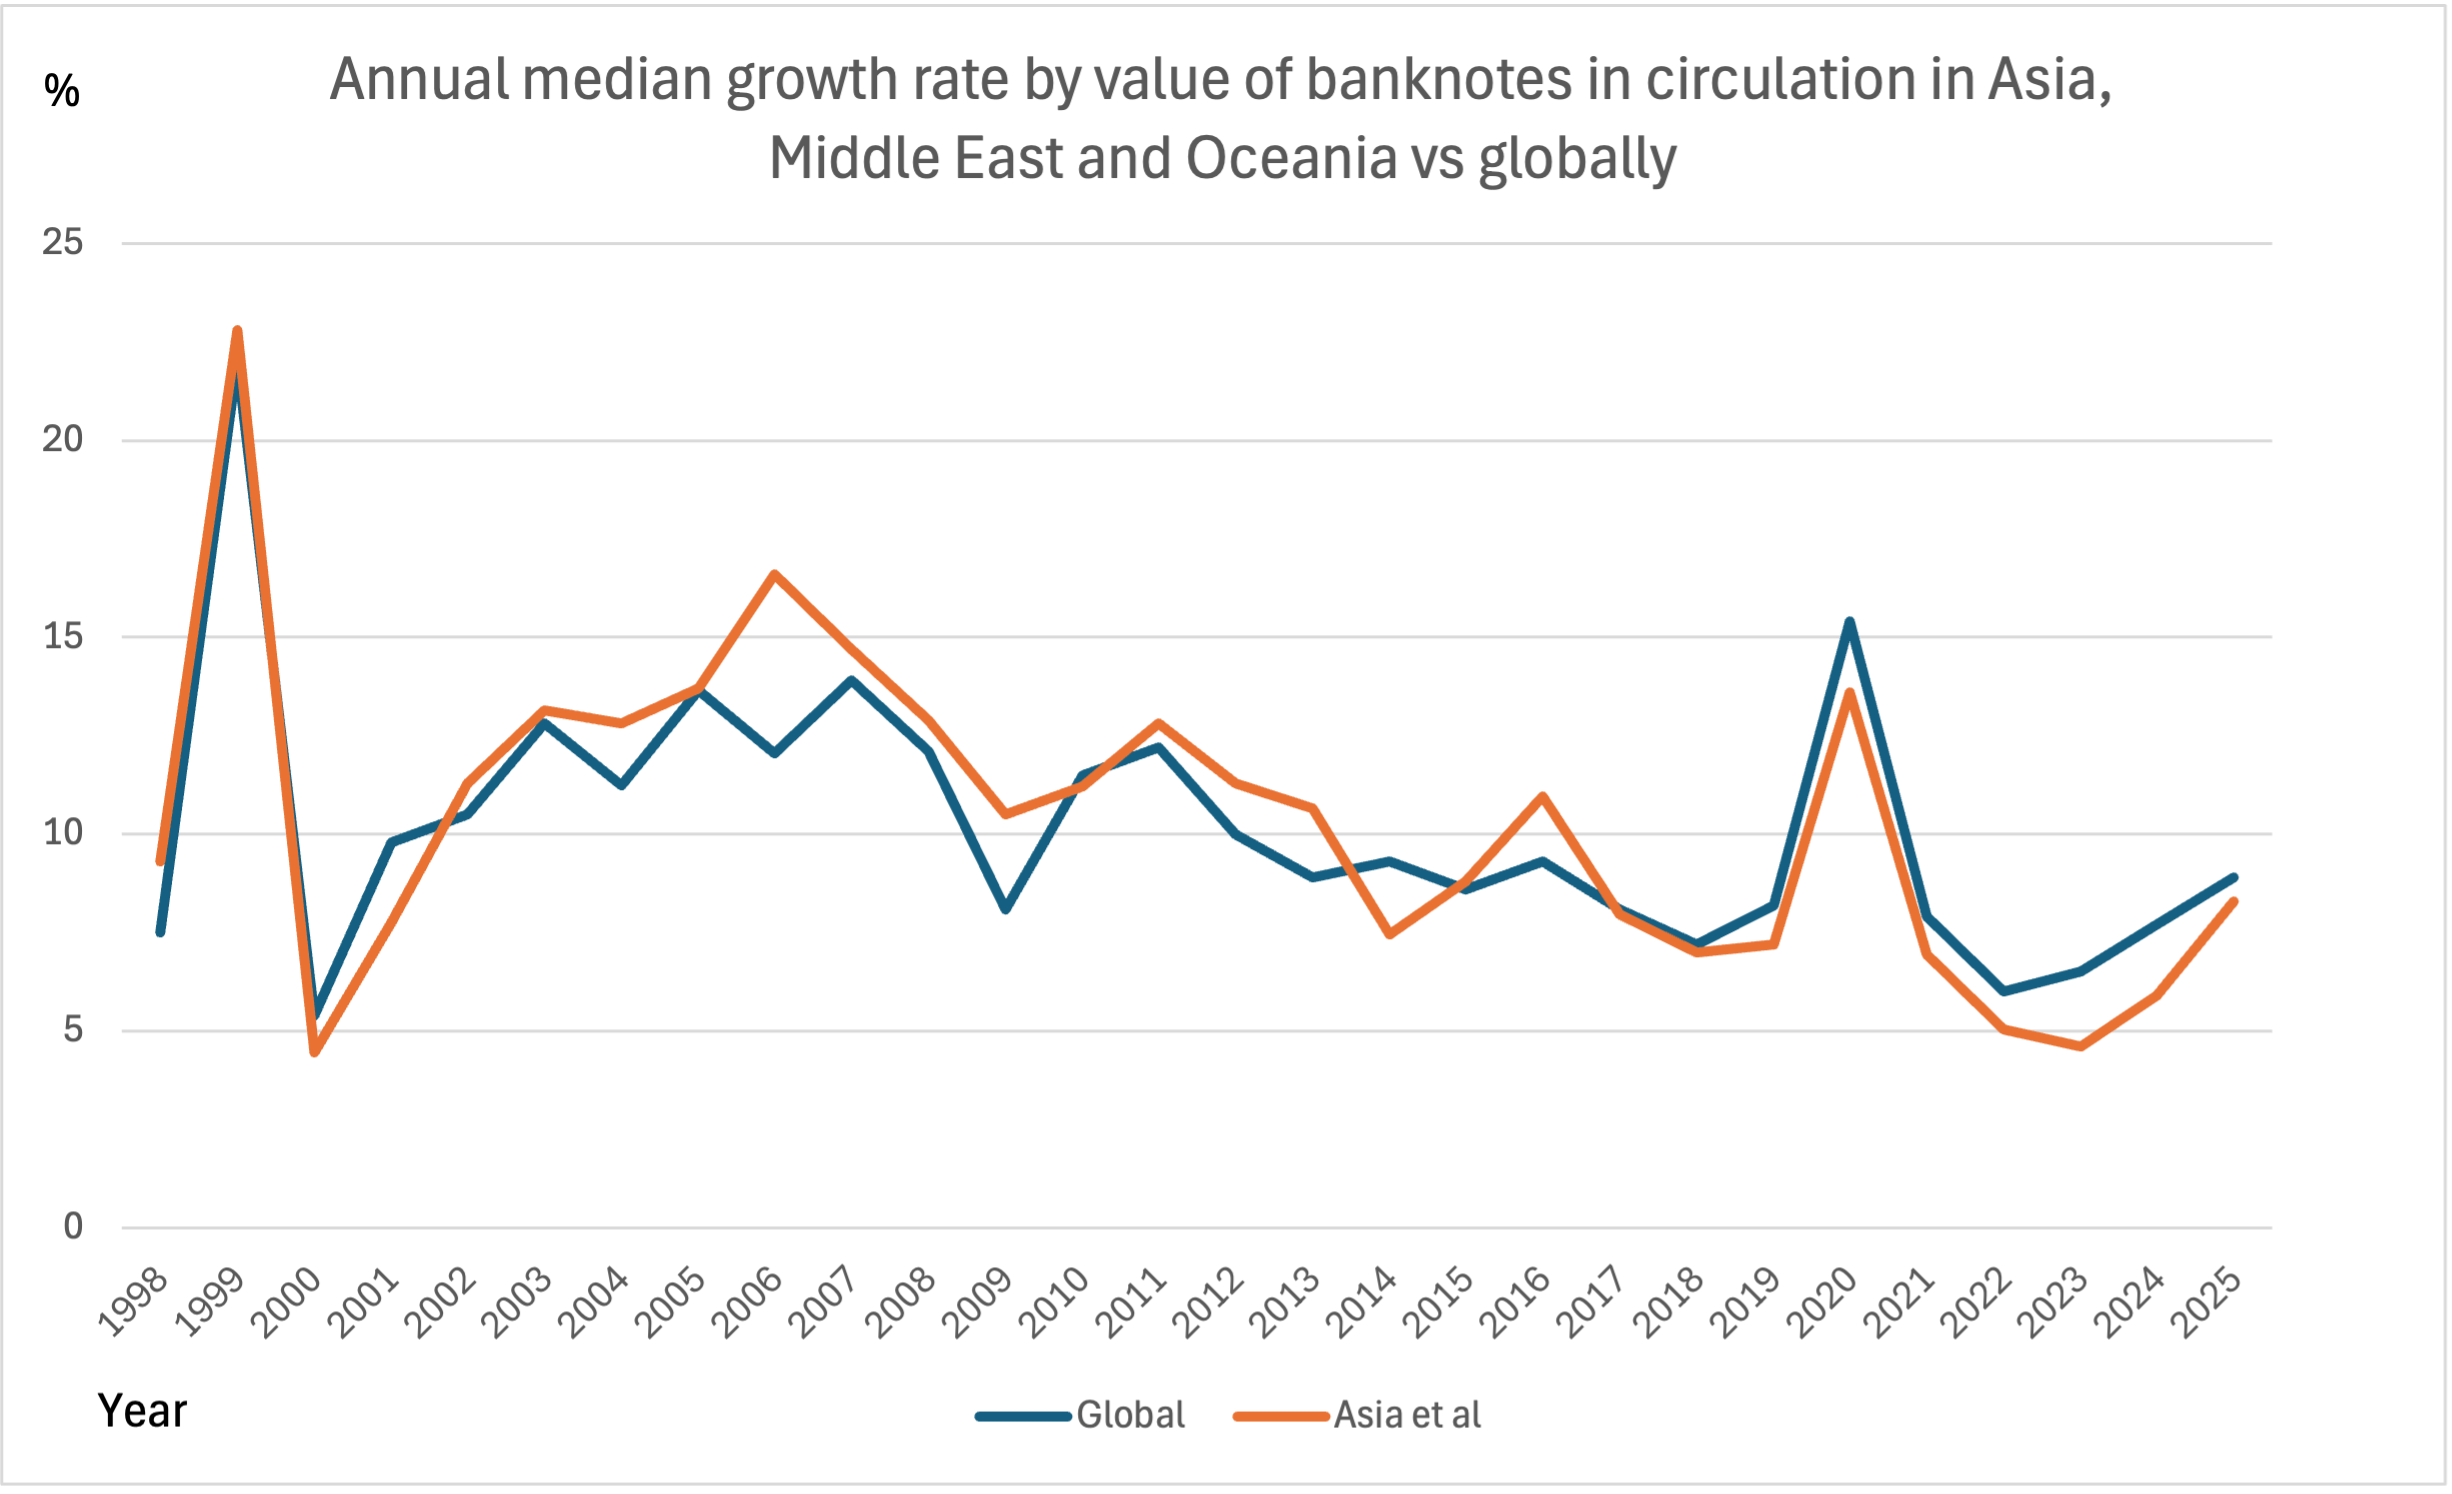
The development in this region doesn’t differ significantly from that globally, similarly as with the Americas. In view of the fact that this region includes close to 40% of all currencies, big differences were not to be expected. The major difference in development was in 2006, when the median growth rate in this region was exceptionally high, more than 16.5%, second highest during the whole period.
The remaining region to be illustrated is Europe. Given that the chart for Africa showed significantly higher median growth rates than globally, and the two other areas had no major differences from global, Europe should present an opposite development to that of Africa. Not unexpectedly this is the case, as shown in Figure 5.
Fig 5: Annual median growth rate by value of banknotes in circulation in 1998−2025 in Europe vs globally
(on average 24 and 147 currencies respectively).
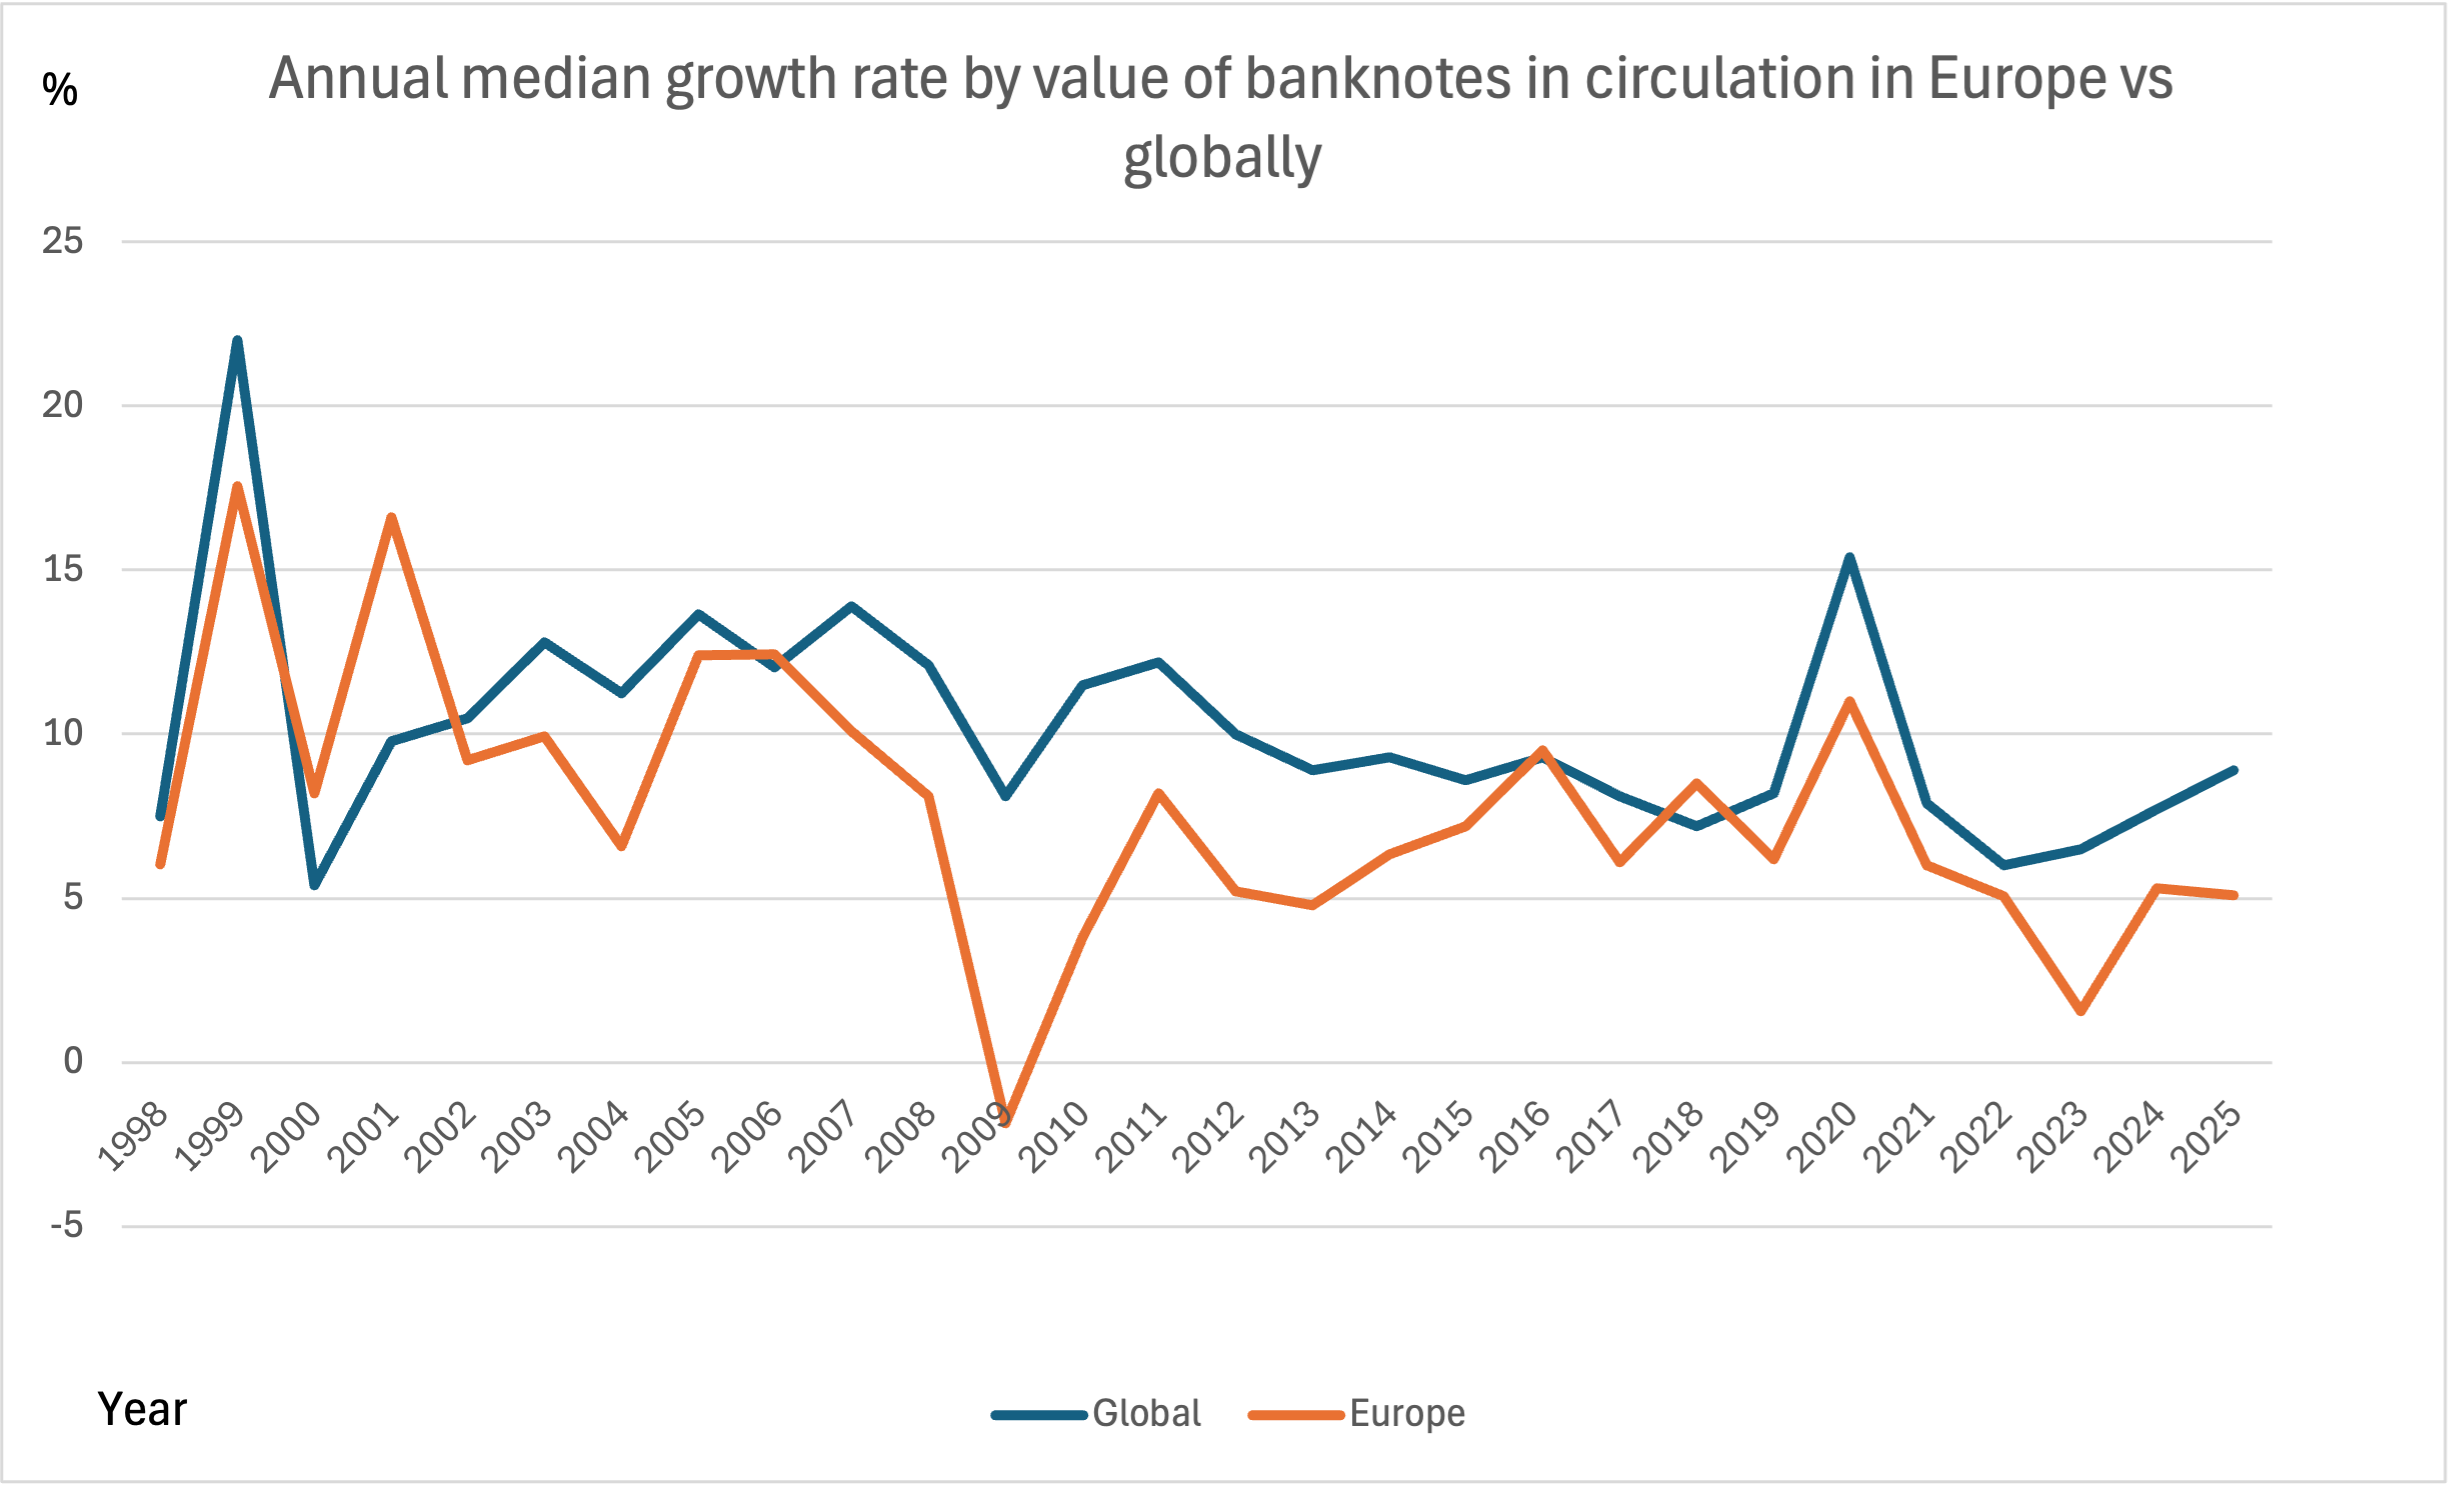
Figure 5 shows that the development in Europe has differed significantly from the global. Moreover, the reactions to global uncertainties have been more modest in Europe than globally, except that after the financial crisis the abandonment of extra cash balances even led to a negative median growth rate in 2009. Similarly, after the abandonment of cash balances built up during the pandemic, the downward trend continued in Europe in 2023, even though there had been already a turn globally.
One specific feature in the European development was the high median growth rate in 2001. It was almost as high as that in anticipation of Y2K and doesn’t have any immediate explanation.
Even though the study of the development in value terms shows the strong reaction of note demand to great uncertainties and confirms that the demand differs in various regions of the world, this is only part of the story. The industry doesn’t produce, process, transport or destroy values but volumes. Therefore, the volume development, the growth rate by the number of banknotes in circulation, is much more important than that of the value.
Unfortunately, banknote volume data has much less coverage in the publications of central banks. Therefore, merely the global development of volumes, not that by regions, will be addressed currently. Moreover, only the great support by several central bank colleagues, who have provided unpublished data, has made possible the following study of the global development by number of notes in circulation since 1998.
Global banknote circulation in volume terms in 1998−2024
As the subheading indicates, the study in volume terms doesn’t include the 2025 figures, since data for many currencies will be published only later this year. Figure 6 shows the global volume development in comparison to value development in 1998−2024. Furthermore, some of the volume figures refer to end of the financial year, not to the end of the calendar year. The reason is that the respective central banks publish the volume figures only at the end of their financial year.
Fig 6: Annual median growth rates by value and volume of banknotes in circulation in 1998−2024
(on average 147 and 102 currencies respectively).
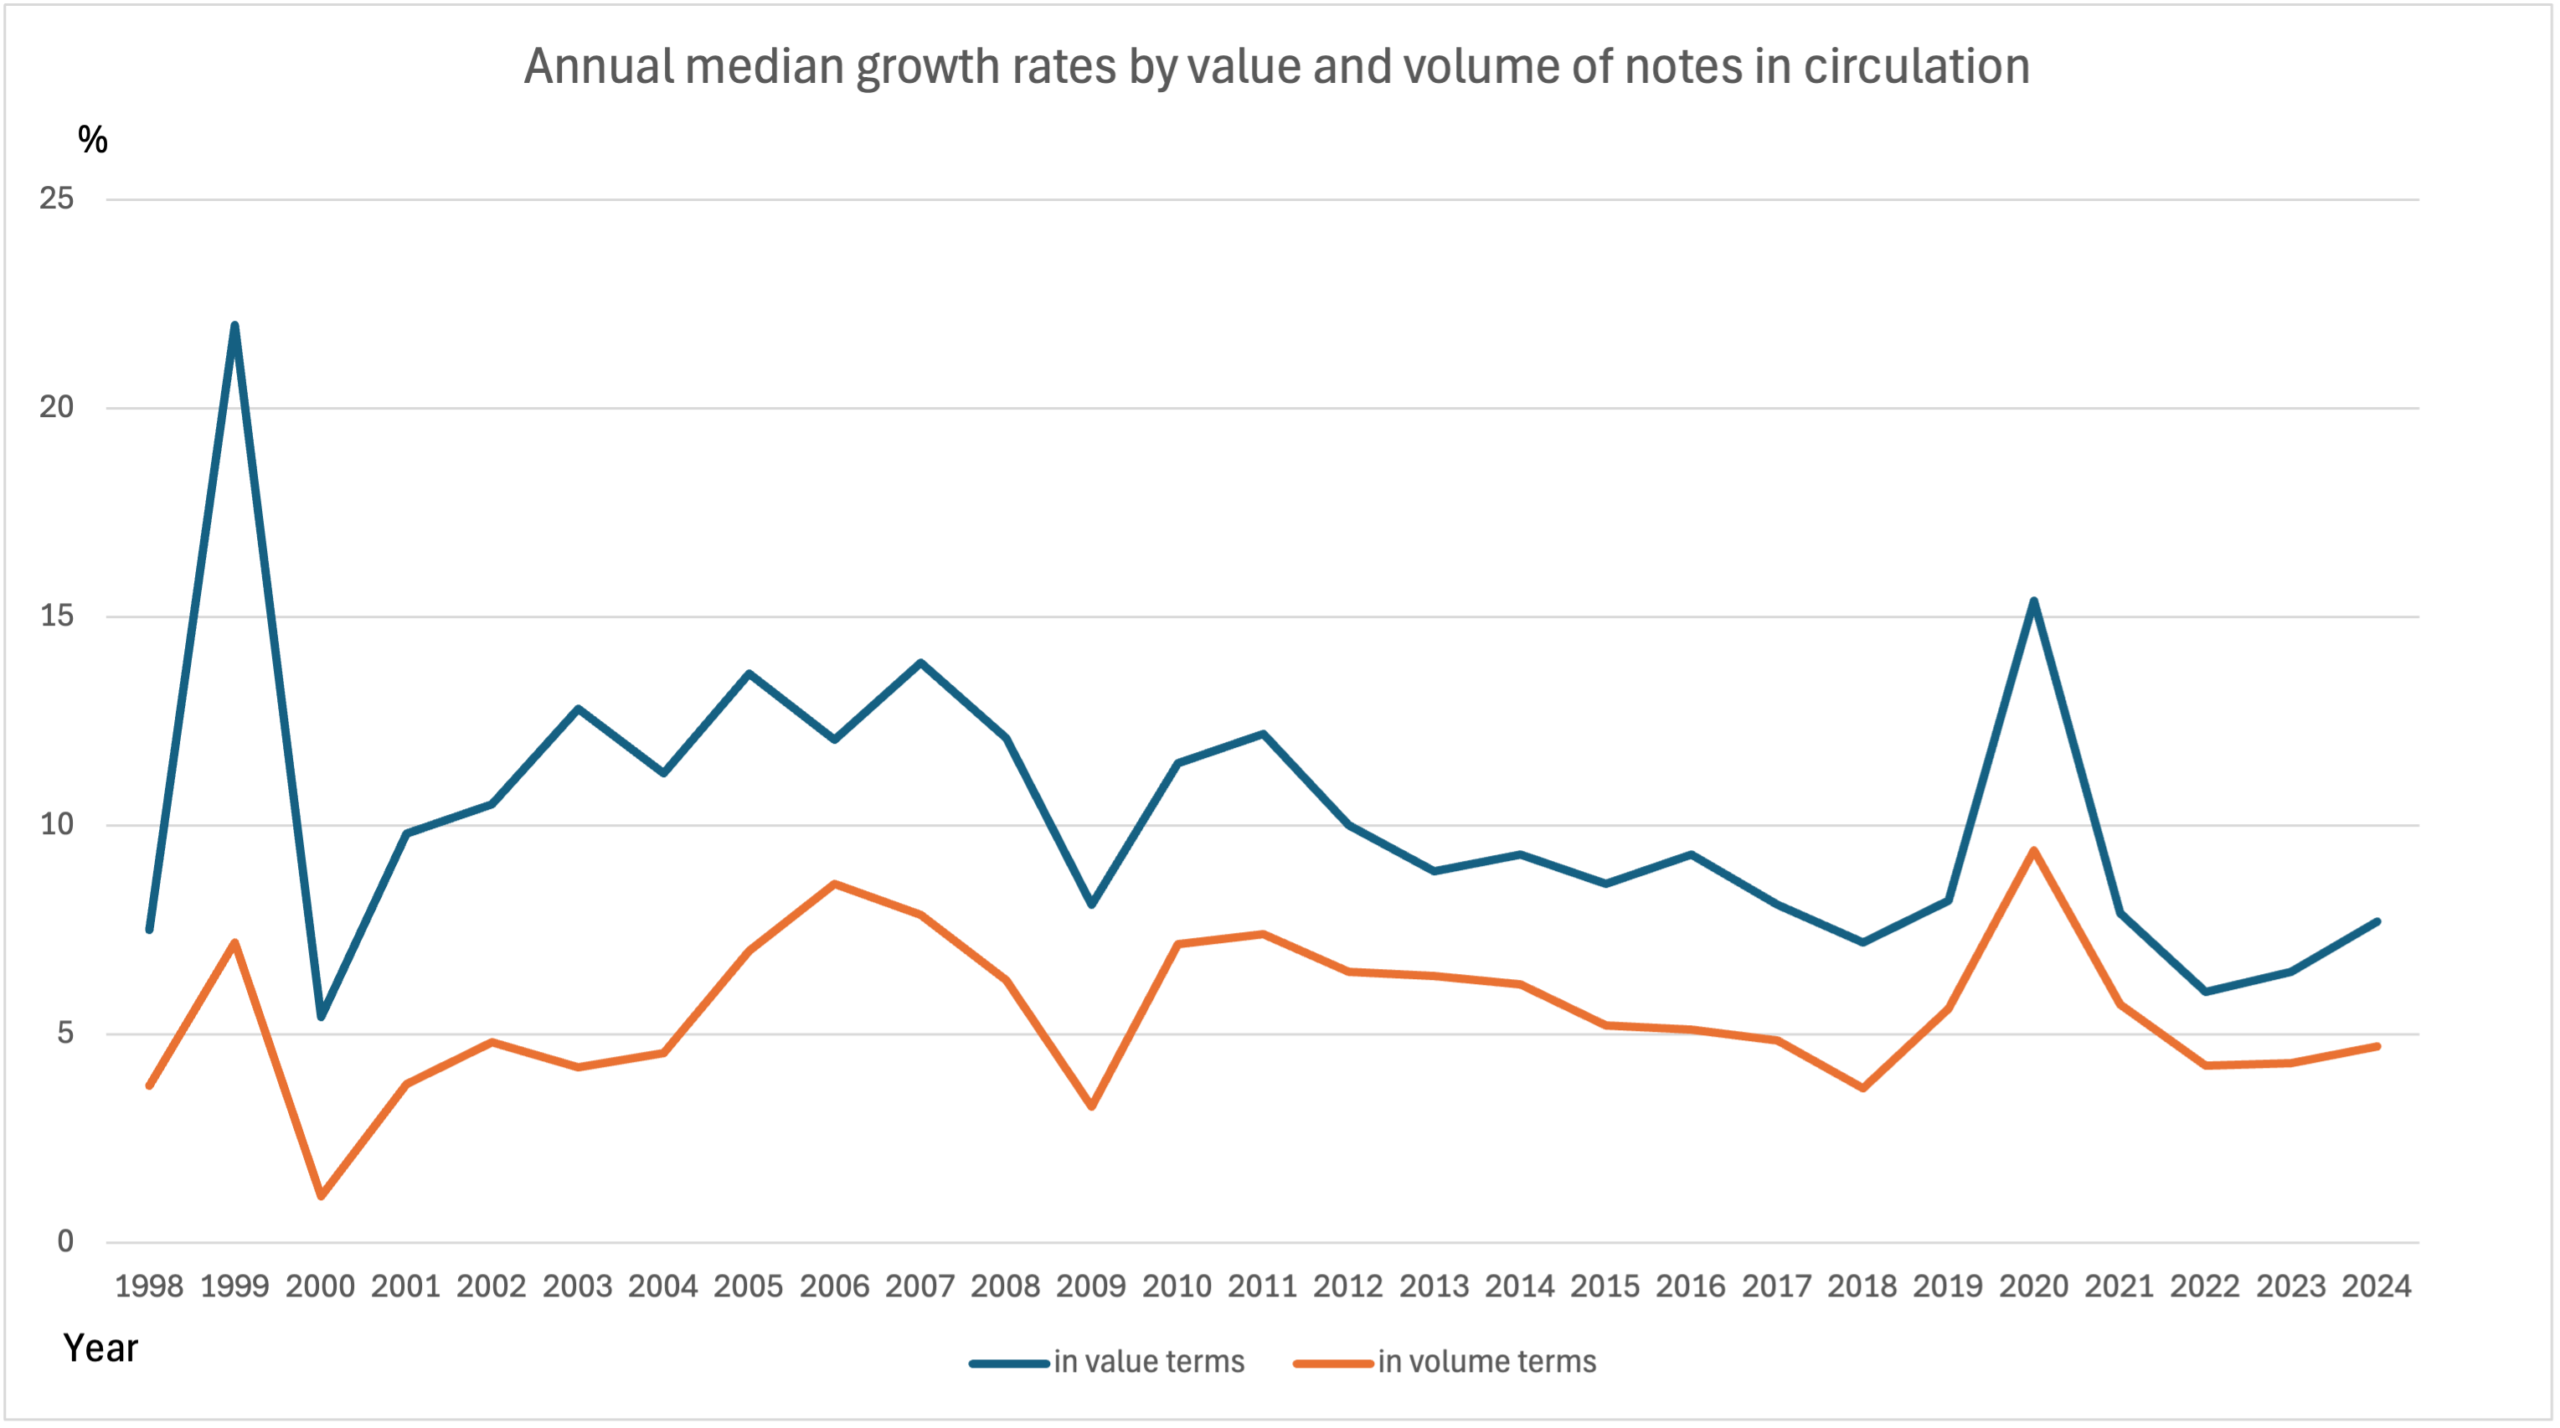
Figure 6 highlights several interesting issues. Firstly, the volume development measured by annual median growth rate is consistently lower than in value terms. The larger the difference between the two graphs, the bigger is the role of high denominationEach individual value in a series of banknotes or coins. More notes in the demand. Accordingly, the significant increase of the median growth rate in value terms in anticipation of the Y2K was mainly the consequence of the demand for high denominations, while the demand at the outbreak of COVID-19 fell more evenly upon various denominations.
Figure 6 also illustrates that the volume development has mostly followed that by the value, but its volatility measured by median growth rate has been more modest than that by value.
Moreover, the gap between the two graphs has narrowed in the course of time, which means that the demand for different denominations has become more balanced. In addition, the volume development has been reasonably stable during the last decade. Only, the pandemic had a significant impact on volume development.
Concluding remarks
The study regarding the value development of banknotes in circulation globally and by regions since 1998 doesn’t bring any great surprises and mainly confirms some earlier observations. Firstly, the strong reactions of precautionary demand to global uncertainties and, secondly, the significant regional or even continental differences in the growth rates of notes in circulation measured by the median growth rates. It is interesting to follow the future value developments in these respects.
The volume development has been less volatile than that in value terms, and during the last decade quite stable except in 2020 during the outbreak of the pandemic.
Even if the volume development is more important to the industry than value, it is again only part of the story. Besides development of stock values, like the growth rates of the number of banknotes at the end of the year, flow values such as the number of notes produced, withdrawn and lodged, processed and destroyed annually have more impact on the future of the stakeholders of the cash cycleRepresents the various stages of the lifecycle of cash, from issuance by the central bank, circulation in the economy, to destruction by the central bank. More and the cash infrastructure.
More published data on these variables would be appreciated from central banks.