Cash and Digital Payments After the Covid-19 Pandemic
Ph.D. in U.S. History, Columbia University in the City of New York
Post-Doctoral Researcher in Global Correspondent Banking, 1870-2000 – Mexico and South America, University of Oxford
This post is also available in:
![]()
“The Pandemic, Cash and Retail Payment Behaviour,” a new working paperSee Banknote paper. More by Raphael Auer, Giulio Cornelli, and Jon Frost, economists at the Bank for International Settlements (BIS), examines the impact of the Covid-19 pandemic on retail payments with a new “Future of Payments” database.
Database Construction
The database includes weekly or monthly data on cashMoney in physical form such as banknotes and coins. More, credit card payments, initiatives to develop central bank digital currencies (CBDCs), relevant internet searches, and digital paymentA transfer of funds which discharges an obligation on the part of a payer vis-à-vis a payee. More apps’ use for up to 95 countries from September 2019 to June 2022.
Main Findings
The authors found that the Covid-19 pandemic led to an increase in internet searches for “cash and virus” in countries worldwide (Graph 1, left), most markedly in countries with more stringent lockdowns (Graph 1, right). These results update previous work from the BIS Bulletin 3 (2020).
Graph 1. Search Intensity of Relevant Terms and Lockdowns’ Stringency, 2019-2022
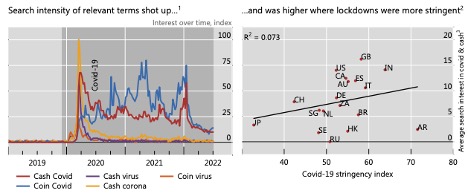
Notes: Shaded areas in the left panel indicate months since the outbreak of Covid-19 (December 2019). Source: Auer, Cornelli, Frost (2022: 3).
The volume of cash in circulationThe value (or number of units) of the banknotes and coins in circulation within an economy. Cash in circulation is included in the M1 monetary aggregate and comprises only the banknotes and coins in circulation outside the Monetary Financial Institutions (MFI), as stated in the consolidated balance sheet of the MFIs, which means that the cash issued and held by the MFIs has been subtracted (“cash reserves”). Cash in circulation does not include the balance of the central bank’s own banknot... More (Graph 2, left), contactless transactions (Graph 2, center), card-not-present payments (Graph 2, right), and payment app downloads increased with stringent lockdowns, albeit with significant heterogeneity across countries.
- Increases in digital payments were less dramatic in countries with higher mobile penetration rates (Auer, Cornelli, Frost 2022: 4, 13-16).
- More stringent lockdowns are associated with increased cash circulation levels (Auer, Cornelli, Frost 2022: 13).
- The data suggest some effects reversed once lockdowns eased and mobility rebounded.
Graph 2. Cash in Circulation, Contactless Payments, and Card-Not-Present Payments, September 2019-June 2022
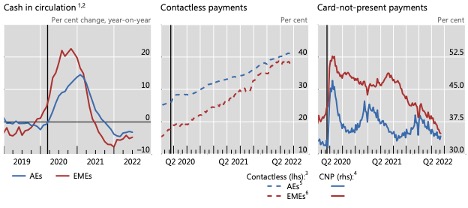
Notes: AEs: Advanced Economies. EMEs: Emerging Market Economies. Black vertical lines indicate March 11, 2020, when the World Health Organization (WHO) declared the Covid-19 outbreak a “public health emergency of international concern.” Source: Auer, Cornelli, Frost (2022: 3).
Cash
“Within countries, a key issue is disparity in access to payment instruments, with gaps in access to digital payments for unbanked and elderly customers. Any shift away from cash might have distributional ramifications. If cash is not widely accepted as a form of payment, it may create a ‘payments divide’ between those who have access to digital payments and those who do not. This, in turn, might have a particularly negative impact on unbanked and elderly clients.” – Auer, Cornelli, Frost (2022: 17).
Cash in circulation surged across 95 countries, with an average 10% year-on-year growth rate by 2020Q2 (Graph 3, left). By the end of 2021, the median ratio of cash in circulation to GDP reached 8% across the sample. Still, it fell slightly in 2022 (Graph 3, center). Internet searches for “ATM near me” dropped but rebounded by the end of the period (Graph 3, right).
Graph 3. Cash in Circulation and Searches for ATMs, September 2019-June 2022
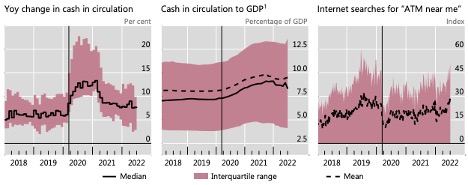
Source: Auer, Cornelli, Frost (2022: 8).
Cash use at the point of sale (POSAbbreviation for “point of sale”. See Point-of-Sale terminal. More) has declined in advanced economies (see Graph 4). However, cash remains dominant as a payment instrumentDevice, tool, procedure or system used to make a transaction or settle a debt. More in most emerging markets, and the precautionary demand for cash increased worldwide during the pandemic.
Graph 4. Cash Use in Emerging Markets and Advanced Economies, 2010 and 2020
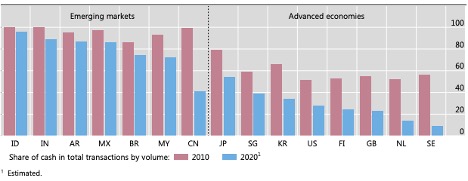
Source: Auer, Cornelli, Frost (2022: 10).
Digital Payments
“Uniform access to payment services is crucial in promoting equitable and sustainable development, and a precondition for international convergence of living standards. Despite significant progress on the financial inclusionA process by which individuals and businesses can access appropriate, affordable, and timely financial products and services. These include banking, loan, equity, and insurance products. While it is recognised that not all individuals need or want financial services, the goal of financial inclusion is to remove all barriers, both supply side and demand side. Supply side barriers stem from financial institutions themselves. They often indicate poor financial infrastructure, and include lack of ne... More objective, large portions of the population continue to be excluded from digital payments.” – Auer, Cornelli, Frost (2022: 17).
The share of card-present payments in card payments fell 20% from March 11 to April 13 before rebounding (Graph 5, left panel). The percentage of card-not-present payments rose by 18% in the acute phase of the pandemic. Still, it fell again as lockdowns ended (Graph 5, center panel). The share of contactless transactions rose in many countries but varied widely across countries (Graph 5, right panel).
Graph 5. Card Payments, September 2019-June 2022
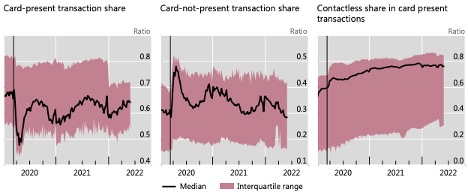
Source: Auer, Cornelli, Frost (2022: 9).
Payment app downloads surged globally, particularly in January-March 2020 and 2021 (Graph 6, left). Weekly active use surged in India in November 2021, with a noticeable impact on the total. Within countries, downloads increased in the first months of the pandemic and early and late 2021 (Graph 6, center). Weekly active users grew more steadily (Graph 6, right).
Graph 6. Payment App Downloads and Use, September 2019-June 2022
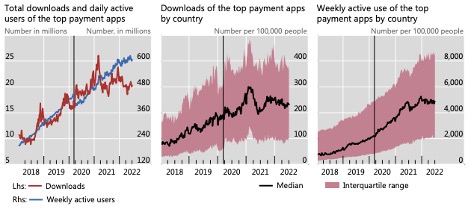
Source: Auer, Cornelli, Frost (2022: 10).
CBDCs
“Access to [cash] alternatives is far from ubiquitous in many emerging market and developing nations where authorities have recently asked for more usage of digital payments. This might be a major argument in the future, calling for a stronger role for physical currencyThe money used in a particular country at a particular time, like dollar, yen, euro, etc., consisting of banknotes and coins, that does not require endorsement as a medium of exchange. More, and potentially calling for a digital complement for online transactions, i.e. a retail CBDC.” – Auer, Cornelli, Frost (2022: 17).
Work on central bank digital currencies (CBDCs) accelerated during the Covid-19 pandemic. Central bank speeches on CBDCs have increased and are more favorable (Graph 7, left). There were over 60 publicly announced CBDC projects by March 2021 (Graph 7, right).
- The People’s Bank of China (PBoC) has launched digital yuan (e-CNY) pilot programs since 2019 in cities including Beijing, Shanghai, Shenzhen, Suzhou, and Chengdu.
- The Central Bank of the Bahamas launched the Sand DollarMonetary unit of the United States of America, and a number of other countries e.g. Australia, Canada and New Zealand. More in October 2020.
- The Eastern Caribbean Central Bank (ECCB) launched the DCash in March 20201.
- The Central Bank of Nigeria (CBN) launched the e-Naira in October 2021.
- The Bank of Jamaica started rolling out JAM-DEX in 2022Q1.
Graph 7. CBDCs: Central Banks’ Speeches and Projects, September 2019-June 2022
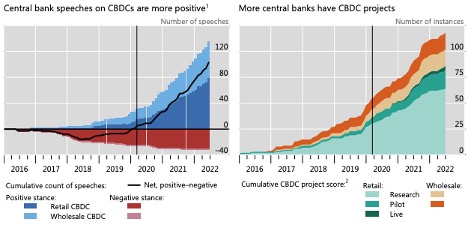
Source: Auer, Cornelli, Frost (2022: 11).
Many central banks announced they were launching CBDC projects very close to March 2020, when the pandemic started (Graph 8, left). Based on internet searches, public interest in CBDCs has increased (Graph 8, right).
Graph 8. CBDCs: Retail Projects and Search Interest, September 2019-June 2022
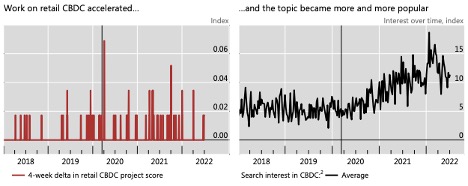
Source: Auer, Cornelli, Frost (2022: 12).
This post is also available in:
![]()