The Paradoxical Development of the Usage of Cash: A Global Update
This post is also available in:
![]()
The lockdowns and travel restrictions caused by the Covid-19 pandemic have had a great influence on retail shopping and paymentA transfer of funds which discharges an obligation on the part of a payer vis-à-vis a payee. More habits. Besides the increase in online shopping, the growing use of contactless and mobile payments media has decreased cashMoney in physical form such as banknotes and coins. More in transactions. Several recent payment studies confirm these developments.
At the same time and opposite to the transactional demand for cash, the precautionary demand has grown as is typical in times of uncertainty. This paradoxical development of the two motives to use cash has been evident already for several years, but the ongoing pandemic has accelerated the trend.
During the Covid-19 pandemic, the use of cash as a store of valueOne of the functions of money or more generally of any asset that can be saved and exchanged at a later time without loss of its purchasing power. See also Precautionary Holdings. More has reached record growth rates not seen since the financial crisis in 2008. This phenomenon has already been addressed in some articles but referring only to the development of some main currencies.
To illustrate the exceptional situation more broadly, the annual update on banknoteA banknote (or ‘bill’ as it is often referred to in the US) is a type of negotiable promissory note, issued by a bank or other licensed authority, payable to the bearer on demand. More developments at the global level in its fifth year (see CurrencyThe money used in a particular country at a particular time, like dollar, yen, euro, etc., consisting of banknotes and coins, that does not require endorsement as a medium of exchange. More News™, September 2017, 2018, 2019, and 2020) will this time be published in two parts.
The current article will focus on the banknote circulation in value terms in 2020, comparing it with the past and drawing some tentative conclusions regarding the cash infrastructure concerning the growing interest of central banks in digital currency.
Another article will be published in a later issue of Currency News, when more extensive information is available in volume terms, which will also allow us to consider denominational demand. That article will further elaborate on the developments and consider their potential implications for the future of cash.
Banknote Circulation in Value Terms in 2020
When addressing banknote demand globally, the most widely publicly available information is the value of banknotes in circulation. Besides ‘banknotes in circulation,’ the only available figure in some cases is ‘cash in circulationThe value (or number of units) of the banknotes and coins in circulation within an economy. Cash in circulation is included in the M1 monetary aggregate and comprises only the banknotes and coins in circulation outside the Monetary Financial Institutions (MFI), as stated in the consolidated balance sheet of the MFIs, which means that the cash issued and held by the MFIs has been subtracted (“cash reserves”). Cash in circulation does not include the balance of the central bank’s own banknot... More,’ i.e., the figure also includes coins, which are generally just a few percentages of the total cash in circulation or ‘currency outside banks.’
The latter figure excludes the banks’ vaultSafe; strong room. A place reinforced with special security measures where high-value objects and documents are safeguarded. In central banks, banknotes and other objects are safeguarded in vaults. More cash. After central banks have introduced negative interest rates, vault cash has increased exponentially in some currencies. So not including it would give a wrong impression on the demand for banknotes.
However, only very few central banks use negative interest rates, and these central banks typically also publish the banknotes in circulation figures. Therefore, using slightly differing concepts will have only a minor, if any, impact on the results of this study.
Using statistics and various publications available on central bank websites, a slightly varying number of currencies (between 136 and 142) has been addressed in the following charts. The figures refer in most cases to the end of the year (in some cases, the financial year is not the calendar year, and the figures may refer to the end of the financial year).
Let us look first at the annual growth rates by the value of banknotes in circulation in 2020, described in Figure 1.
Figure 1. Annual Growth Rates by Value of Banknotes in Circulation of 140 Currencies, 2020.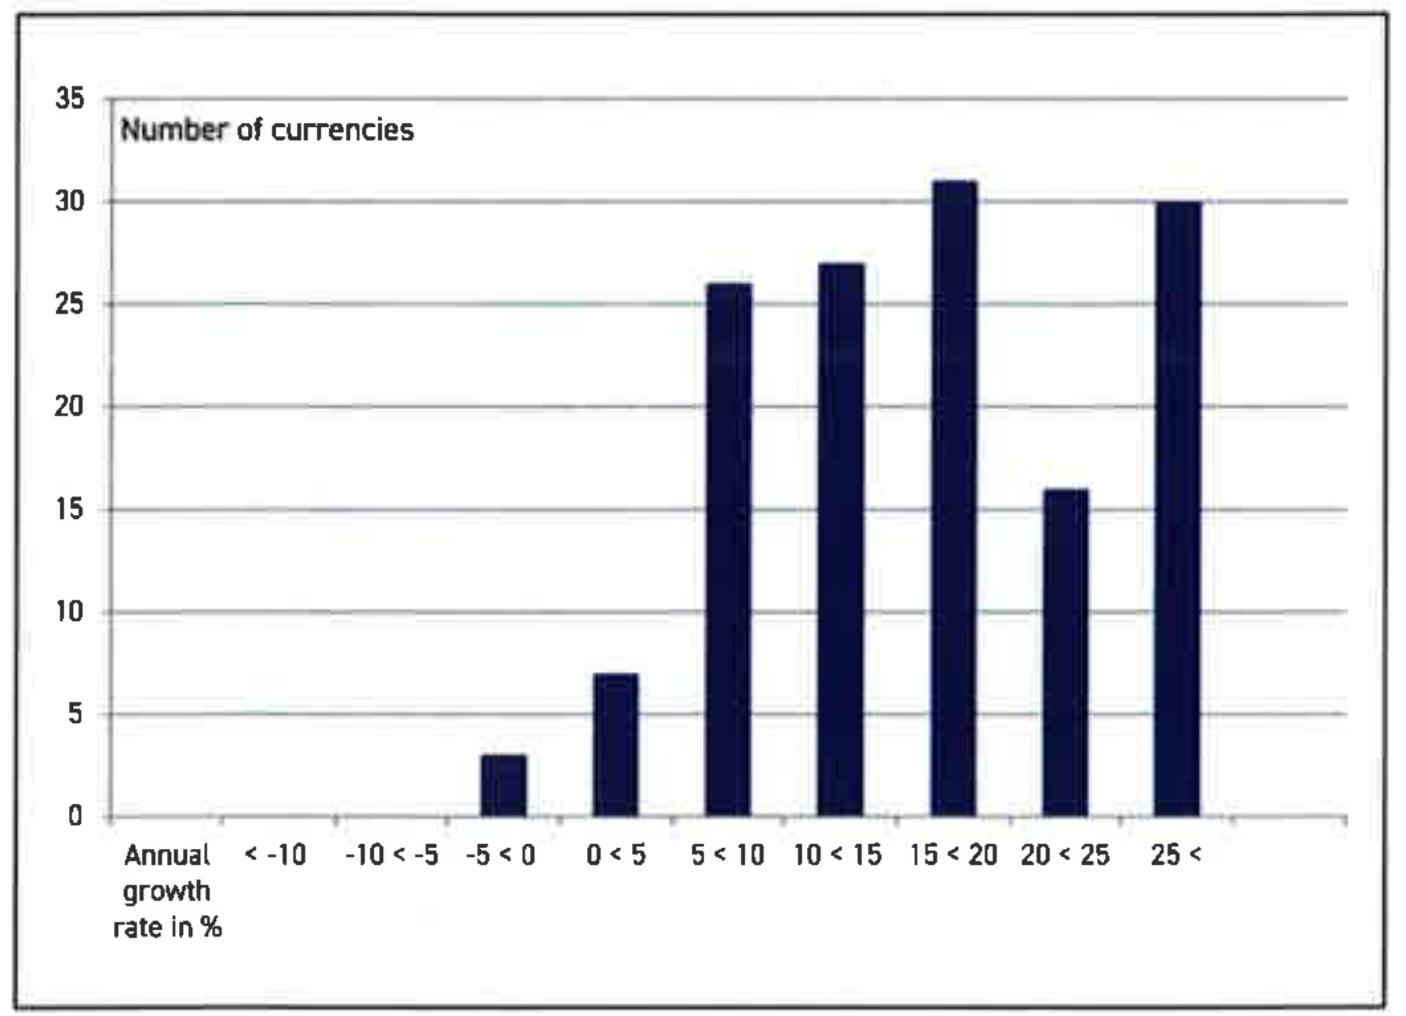
The distribution of currencies between various brackets of growth rates in 2020 is very untypical compared to earlier years. It is quite skewed to the right, and only three currencies (besides the usual suspects of the Swedish krona and Norwegian krone and the dollarMonetary unit of the United States of America, and a number of other countries e.g. Australia, Canada and New Zealand. More of Trinidad and Tobago) had a negative growth rate in 2020. In the last-mentioned case, the surprise demonetisationSee Demonetised banknote. More of the highest denominationEach individual value in a series of banknotes or coins. More, the $100 note, in early December 2019 probably had a bearing.
All in all, only a tiny number of currencies had a growth rate of less than 5%. It is, indeed, surprising how universal the run for cash has been during the pandemic, with almost 75% of the currencies having a double-digit growth rate. The difference between the pandemic year and the still ‘normal’ 2019 can be clearly seen in Figure 2.
Figure 2. Annual Growth Rates by Value of Banknotes in Circulation, 2019-2020.
The distribution in 2019 is remarkably centered, resembling the normal distribution, and only 36% of the currencies had a double-digit annual growth rate. The median growth rates describe the difference between the two years similarly. It was more than double in 2020 and was 16.5%.
The exceptionality of 2020 can be further highlighted by comparing it with several other years in the last decade in Figure 3. The distributions in 2012, 2014, 2016, and 2018 are quite similar to each other but deviate fundamentally from 2020. Therefore, it is not surprising that 43% of the 140 currencies had in 2020 their highest annual growth rate of the value of banknotes in circulation during the last ten years.
Figure 3. Annual Growth Rates by Value of Banknotes in Circulation, 2012-2020.
Given that the distributions have been similar during the ‘normal’ years in the 2010s, it is interesting to compare the pandemic year of 2020 with another crisis, namely 2008, characterised by the financial crisis. This is addressed in Figure 4.
Figure 4. Annual Growth Rates by Value of Banknotes in Circulation, 2008-2020.
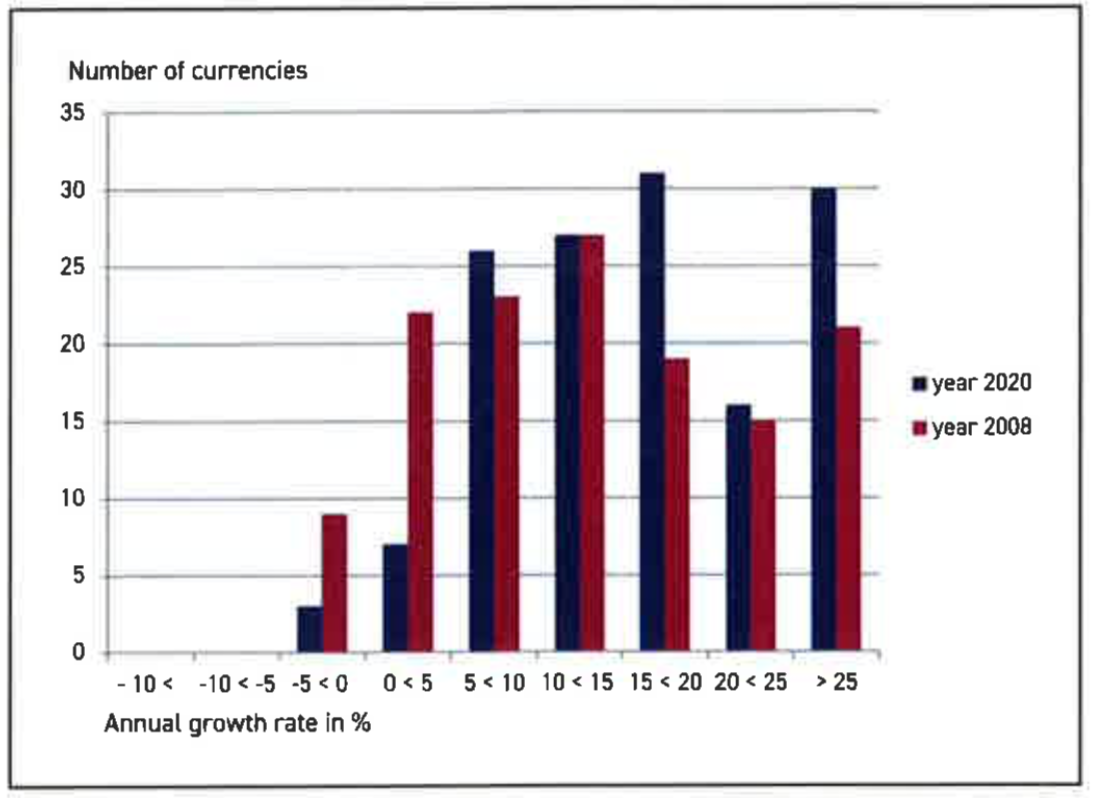
There are indeed some similarities between the distributions in the two crisis years. However, high growth rates of the value of banknotes in circulation were not as universal in 2008 as they were in 2020. Close to 23% of the currencies had a growth rate of less than 5% in 2008 when the same figure in 2020 was only 7%. This notwithstanding that in the 2000’s the annual median growth rates were generally a few percentage points higher than during the latter part of the 2010s.
One reason for the difference might be that the financial crisis was not felt as universally as the pandemic or its threat had been confronted. In addition, there may have been diverse reasons for the precautionary demand during the pandemic, such as general fear of discontinuity of systems and institutions due to infections and self-isolations, as well as limited possibilities to consume, and not just the worry about the collapse of financial institutions as during the financial crisis.
The available data do not allow to dig globally behind the figures that have produced the exceptional growth rates by the value of banknotes in circulation in 2020. However, anecdotal evidence shows that in the case of a few currencies, the result of both withdrawals from and lodgements to the central banks has decreased significantly. The high growth rates in the value of banknotes in circulation have then resulted from a smaller decrease in withdrawals than in lodgements.
This post is also available in:
![]()