U.K.: Cash Infrastructure and Access to Cash
Ph.D. in U.S. History, Columbia University in the City of New York
Post-Doctoral Researcher in Global Correspondent Banking, 1870-2000 – Mexico and South America, University of Oxford
This post is also available in:
![]()
Access to CashMoney in physical form such as banknotes and coins. More in the United Kingdom
The 2020 report “Where to Withdraw? Mapping Access to Cash Across the U.K.” examined the geographic coverage of cash access points in the United Kingdom. Researchers from the University of Bristol collaborated with the Financial Conduct Authority and the PaymentA transfer of funds which discharges an obligation on the part of a payer vis-à-vis a payee. More Systems Regulator to assemble a dataset with 110,000 cash access points, including free-to-use (FTU) and pay-to-use (PTU) ATMs, banks, building societies, credit unions or Post Office branches, and cashbackA service whereby the customer pays electronically a higher amount to a retailer than the value of the purchase for goods and/or services and receives the difference in cash. It is also a reward system associated with credit card usage, whereby the consumer receives a percentage of the amount spent on the credit card. More locations.
The report does not offer information on points to deposit cash, an essential part of the cash infrastructure, as retailers who stop accepting cash claim that they do so as it is difficult to deposit it. Chart 1 summarizes the report’s findings.
Chart 1. United Kingdom: “Where to Withdraw” Report Key Findings, 2020

Source: Tischer, Evans, Cross, Scott, Oxley (2020: 5-6, 21-23).
Cash Infrastructure
As Chart 2 shows, most of the cash access points are FTU ATMs (39%), followed by retailers offering cashback (33%) and PTU ATMs (12%. Most cash access points (55%) provided consumers free access to cash, as FTU ATMs, bank, and Post Office branches do not charge fees or require a purchase for customers to withdraw cash.
Chart 2. United Kingdom: Cash Access Points and Withdrawals, March 2020

Note: Withdrawals comprise 12 months to March 2020.
Source: Tischer, Evans, Cross, Scott, Oxley (2020: 13-15).
FTU ATMs have the highest average volume of withdrawals, at 48,500 withdrawals per year, more than ten times the average for PTU ATMs (see Chart 2). Financial entities conduct about 12,800 withdrawals for customers only. Regarding total withdrawals, most occur at FTU ATMs (85%).
Geographic Distribution of CashActivity consisting of the delivery of cash throughout the territory in the amount and modality required to adequately cover the needs. It is one of the central bank’s core functions, for which the necessary logistics, materials and human resources are used, either in-house or outsourced. More Infrastructure
Median distances to the nearest free access points are below 1 km and stable across regions. Still, they increase in the areas with the lowest population densities. London and the North West have lower median distances than Scotland, Wales, and Northern Ireland.
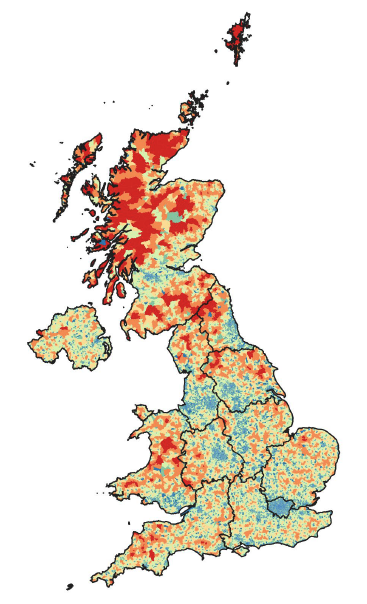
Map 1. United Kingdom: Nearest Free Cash Access Points, 2020
A. Nearest FTU ATM
 B. Nearest Access Point
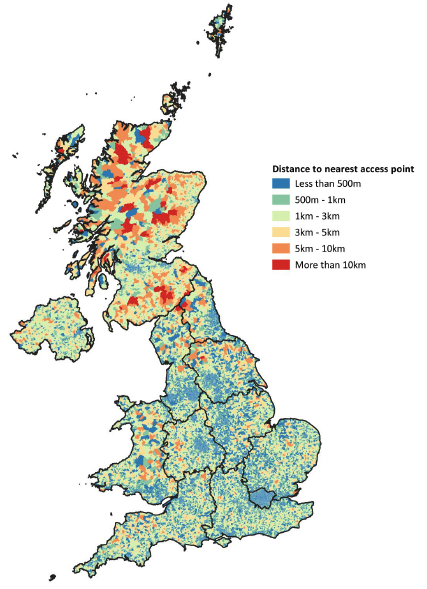
Note: Map B includes FTU ATMs; bank, building society, credit union and Post Office branches; and cashback.
Source: Tischer, Evans, Cross, Scott, Oxley (2020: 13).
ATM Transactions Have Declined the Most in Richer Areas
“Five million people still rely on cash every day and deprivation is the biggest single indicator of cash dependency. […] Increasing numbers of people have been using cash as a budgeting tool during the cost-of-living crisis, and many people from poorer communities also lack the digital skills and the tools necessary to access online banking, such as smart phones and broadband.” – John Howells, CEO of LINK.
Cash demand has recovered since the Covid-19 pandemic. According to UK Finance, wholesale cash centers processed 10% more coins and 7% more notes in 2022 compared to 2021. However, ATM transactions have declined by 40% on average in the United Kingdom since spring 2019, according to the ATM network LINK.
Graph 1 shows LINK transactions and values. LINK transactions occur when a customer uses an ATM that does not belong to their bank, representing around 78% of all cash withdrawals. Transactions fell 37% in 2020 due to the Covid-19 pandemic but grew 4.3% in 2022. Still, the volume of transactions in 2022 represents 61% of that in 2019.
Graph 1. United Kingdom: LINK Transactions and Values
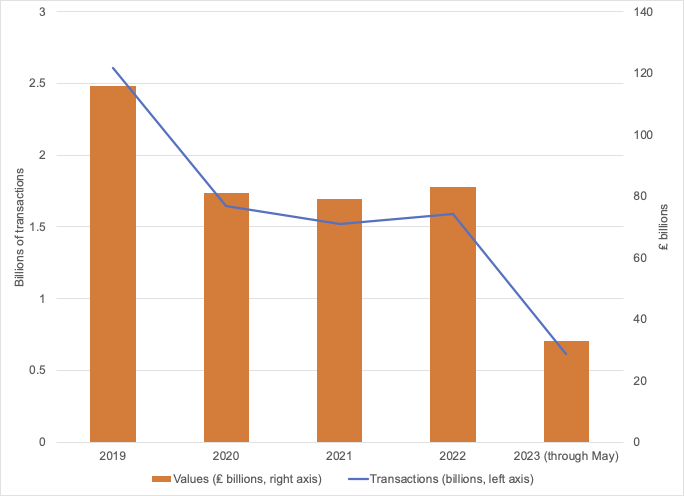
Source: LINK (2023).
People might be using ATMs less, but they are withdrawing more. Withdrawals fell from ₤116 billion in 2019 to ₤81 billion in 2020, a 35% decline. However, withdrawals grew at the yearly rate of 6.9% in 2022, reaching ₤83 billion.
Deprived Areas Remain Cash-Reliant
The frequency of ATM withdrawals has fallen by 60% in certain parts of the United Kingdom, particularly in cities and more affluent areas, such as London and Westminster (64%), Bristol West (63%), Edinburgh (62%), York Central and Edinburgh South (both 60%).
In contrast, poorer U.K. areas have registered smaller declines in ATM withdrawals, including Liverpool, Walton (25%), West Tyrone and Leicester East (both 26%), Wolverhampton South East and Bradford South (27%).
Deprived Areas and Free Access to Cash
While inhabitants in deprived areas remain cash-reliant, their free access to cash seems to be worsening. Tischer et al. (2020: 6, 37, 67) found that PTU ATMs are more likely to be these areas’ nearest source of cash. In the most deprived decile, PTU ATMs grew by 23%, while FTU ATMs declined by 19% between 2018 and 2020.
Graph 2. United Kingdom: Percentage of Neighborhoods with Potential Indicators of Need for Cash with a Free Access Point (Including Cashback) Within Different Distances, 2020.
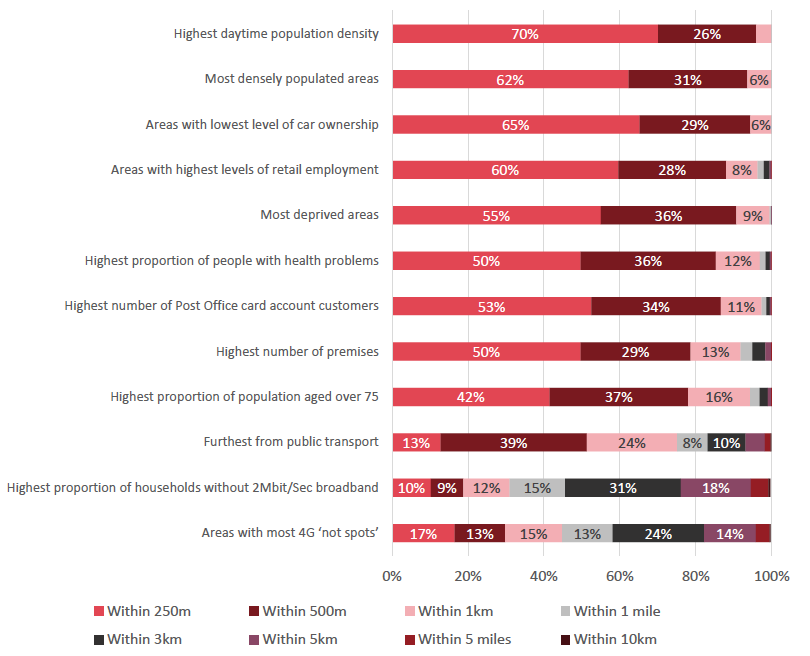
Source: Tischer, Evans, Cross, Scott, Oxley (2020: 27).
Graph 2 indicates the distances to free access points (including cashback) for areas with the highest needs to preserve access to cash (high footfall, financial vulnerability, transport difficulties, older ages, health problems, and limited digital access). Most deprived areas (55%), 42% of sites with the highest proportions of population aged over 75 years, 17% of areas with deficient 4G coverage, 13% of areas furthest from public transport, and only 10% of areas without broadband had access to a free access point within 250 m.
This post is also available in:
![]()