U.K.: The Payment Mix and Cash Usage
Ph.D. in U.S. History, Columbia University in the City of New York
Post-Doctoral Researcher in Global Correspondent Banking, 1870-2000 – Mexico and South America, University of Oxford
This post is also available in:
![]()
UK Finance (the British financial trade group) publishes a yearly UK Consumer Payments report based on results from the National Payments Study (NPS), a survey conducted since 1988. Ipsos MORI undertook the NPS in 2021. The sample comprised 2,063 respondents, representing 54.1 million U.K. adults (aged 16 or over).
The U.K. PaymentA transfer of funds which discharges an obligation on the part of a payer vis-à-vis a payee. More Mix
Cards are the most used payment instrumentDevice, tool, procedure or system used to make a transaction or settle a debt. More in the United Kingdom, with 57% out of 40.4 billion payments in 2021 (UK Finance 2022: 2, see Graph 1 below). Debit cards were used in 48% of payments.
Contactless payments represented nearly a third (32%) of all payments in 2021. In a 2020 study, Merle van den Akker, Neil Stewart, and Andrea Isoni (Warwick Business School) found that people with contactless cards spent “significantly more” than those without. Contactless payments promote “increased spending; decreased cashMoney in physical form such as banknotes and coins. More usage and increased use of debt,” they wrote.
Graph 1. United Kingdom: Payment Mix, 2022

Source: UK Finance (2022: 8).
Payment Cards
Most British adults have at least one payment card. Cardholding went from 92% in 2011 to 99% in 2021; that year, 97% of Brits were debit cardholders, and 66% were credit cardholders (UK Finance 2022: table 2).
From 2020 to 2021, debit cards grew by 3.5%, and debit cardholders increased by 2%. However, credit cards declined by 4.2%, and credit cardholders decreased by 6.2% in the same period, coinciding with the onset of the U.K. cost-of-living crisis (UK Finance 2022: tables 3.1 and 3.2).
Credit card borrowing grew 13% year-on-year in July 2022, its fastest pace since October 2005. Credit card borrowing has decelerated and remained stable at ₤0.6 billion in June 2023 (Bank of England 2023).
Graph 2. United Kingdom: Payment Card Holding, 2011-2021
A. Payment Cards (millions)
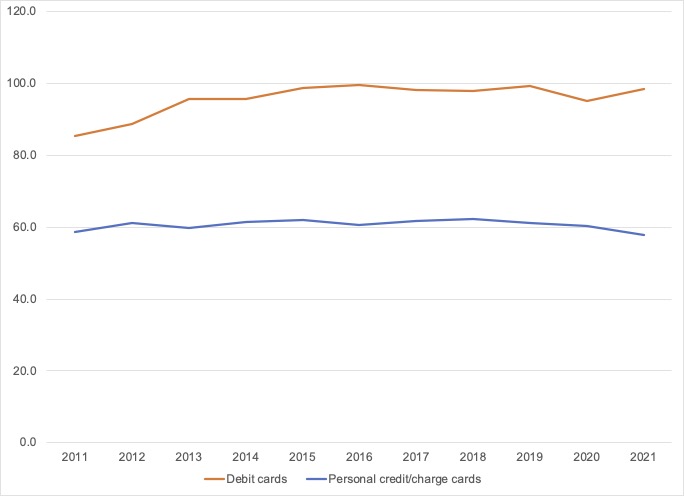
B. Card Holders (millions)

Notes: Debit and personal credit/charge cardholders are average figures. Commercial credit/charge cards are excluded. Source: UK Finance (2022: tables 3.1 and 3.2).
Cash Usage
Despite the widespread adoption of electronic payments, cash is still the second most used payment methodSee Payment instrument. More, with 15% of U.K. payments in 2021 (UK Finance 2022: 2, 4). While the share of cash in U.K. payments has declined markedly since 2012, the trend decelerated sensibly during the Covid-19 pandemic (Graph 3). The percentage of cash in total payments was 56% in 2010, 45% in 2015, and 17% in 2020 (UK Finance 2021: 4).
Graph 3. United Kingdom: Payment Volumes by Instrument, 2011-2021

Source: UK Finance (2022: 1).
Many U.K. consumers have stopped using cards and contactless payments and switched to cash for mindful spending and budgeting during the cost-of-living crisis. The #cashstuffing trend has aided many as they withdraw cash and place it in envelopes for groceries, credit card debt, and emergencies.
There were 6.7 million 50-pence coins featuring Charles III’s image in circulation at his coronation in May 2023. Banknotes with his image will be issued when existing Elizabeth II notes get worn or damaged. “This action will support banking industry commitments to reduce the environmental impact of cash, something the sector has already made progress on,” said David Postings, CEO of UK Finance.
Cash Users
The share of British adults who rarely use cash more than doubled after the widespread adoption of digital payments during the Covid-19 pandemic, increasing from 14% in 2019 to 25% in 2020 (UK Finance 2022: table 4, see Graph 4). The trend continued in 2021 when 23.1 million British adults (42.2%) used cash only once a month or not at all.
Graph 4. United Kingdom: Adults’ Cash Usage, 2016-2021
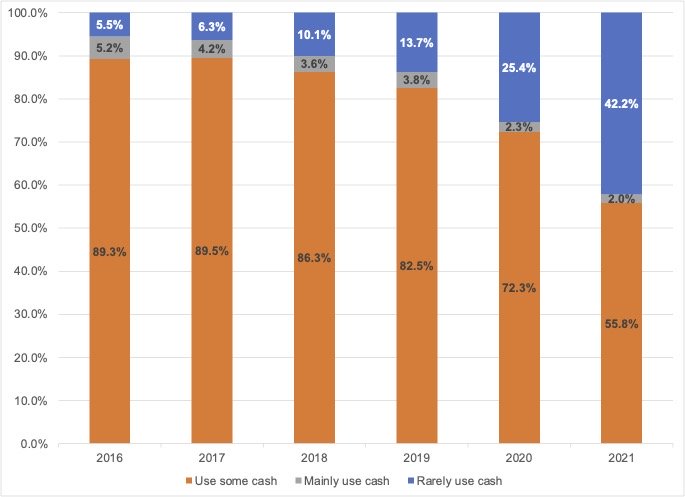
Notes: Rarely use cash: U.K. adults who use cash once a month or less frequently; mainly use cash: adults who only use cash for daily payments; use some cash: residual.
Source: UK Finance (2022: table 4).
In 2016, the share of British adults who mainly used cash in daily payments was 5.2%. The percentage has more than halved, as 1.1 million consumers (2%) primarily used cash in everyday transactions in 2021. The share of British adults who use some cash in daily transactions remained relatively stable between 2016 and 2019. Then, it declined drastically during the Covid-19 pandemic, going from 82.5% in 2019 to 55.8% in 2021. That is, 57.8% of British consumers still employed cash regularly in 2021.
Cash Sources
U.K. cash acquisitions declined 60.4% from 3.58 billion to 1.42 billion between 2011 and 2021, a 60.4% decline (UK Finance 2022: table 16, see Graph 5). CashbackA service whereby the customer pays electronically a higher amount to a retailer than the value of the purchase for goods and/or services and receives the difference in cash. It is also a reward system associated with credit card usage, whereby the consumer receives a percentage of the amount spent on the credit card. More went from being the second cash source in 2011 (with 7% of acquisitions) to almost disappearing. Public benefits (-93%), cashback (-89%), and ATM withdrawals (-46.5%) experienced the most significant declines in this period.
Graph 5. United Kingdom: Cash Sources, 2011-2021

Notes: Business/employer includes wages, salaries, expenses, occupational pensions, and other business-to-individual payments.
Source: UK Finance (2022: table 16).
ATM withdrawals have long been the first cash source for the British public. In 2011, 80% of cash acquisitions occurred at ATMs, which increased to 88% in 2021. Business/employer payments (including wages, salaries, expenses, etc.) were the second cash source in 2021, at 5%.
This post is also available in:
![]()