United States: Coin Production and Circulation
Ph.D. in U.S. History, Columbia University in the City of New York
Post-Doctoral Researcher in Global Correspondent Banking, 1870-2000 – Mexico and South America, University of Oxford
This post is also available in:
![]()
U.S. MintAn industrial facility manufacturing coins. More: Production Figures
The U.S. Mint’s production of circulating coins has increased slightly from 2011 to 2022 (see Graph 1). Production peaked in 2015 at 17,047 billion pieces. The mint’s production ebbed in 2019 at 11,942 billion coins. CoinA coin is a small, flat, round piece of metal alloy (or combination of metals) used primarily as legal tender. Issued by government, they are standardised in weight and composition and are produced at ‘mints’. More production grew 23.7% in 2020, the first year of the Covid-19 pandemic.
Graph 1. United States Mint: Circulating Coins Production, 2011-2022 (Billions of Coins)
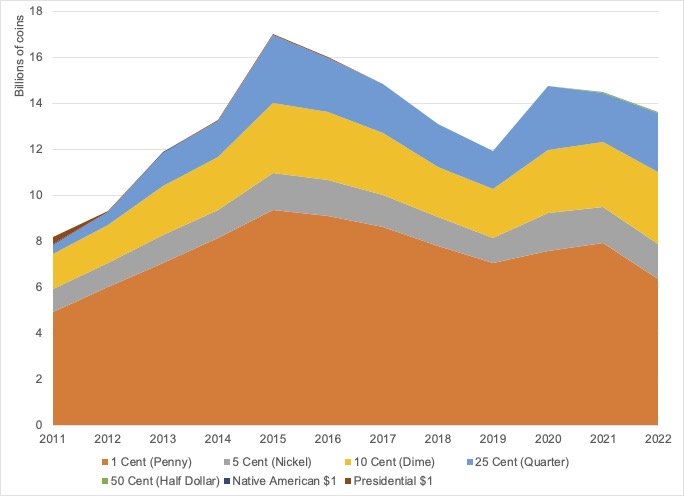
Source: U.S. Mint Circulating Coins: Production (2023).
The U.S. Mint produces billions of new pennies (1-cent coins) and nickels (5-cent coins) each year at Philadelphia and Denver to meet coin orders from the Federal Reserve for banks and retail establishments (see Graph 2).
Pennies’ production peaked in 2016 at 9.365 billion coins; nickels production reached a maximum of 1.623 billion pieces in 2020; dimes’ coinage peaked in 2022 at 3.134 billion coins; quarters output peaked in 2015 at 2.990 billion pieces.
Graph 2. United States Mint: Circulating Coins Production by DenominationEach individual value in a series of banknotes or coins. More, 2011-2022 (Billions of Coins)

Source: U.S. Mint Circulating Coins: Production (2023).
In 2022, pennies represented 47% of the U.S. Mint’s total production; nickels reached 11% of coins production, and dimes were 23% of coins produced (see Graph 3).
Graph 3. United States Mint: Coins Production by Denomination, 2023 (Percentages)
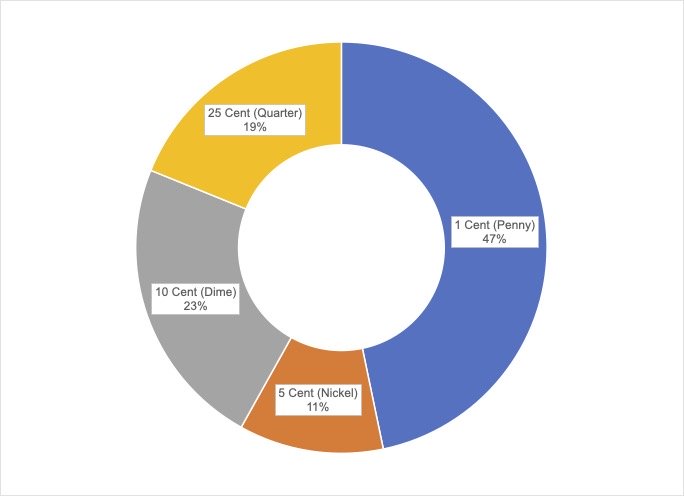
Source: U.S. Mint Circulating Coins: Production (2023).
Coin Circulation and the Covid-19 Pandemic
Before the Covid-19 pandemic, the Federal Reserve Banks distributed an average of 70 billion coins to financial institutions (U.S. Mint, Federal Reserve 2022: 5). Recirculating coins helped meet most of the demand.
The onset of the Covid-19 pandemic disrupted coin circulation in the United States, arising from secular trends and pandemic-specific effects (see Figure 1).
Figure 1. United States: Coin Circulation During the Covid-19 Pandemic

Source: U.S. Mint, Federal Reserve (2022: 13).
The Supply Side
“Right now, coins aren’t circulating through the economy as quickly as they were prior to the COVID-19 pandemic, which means that sometimes coins are not readily available where needed. This is NOT a coin supply problem. It’s a circulation problem” – David J. Ryder, U.S. Mint Director.
With the beginning of lockdowns, consumers could not return coins to circulation at commercial service providers (such as tolls, parking meters, laundromats, mass transit systems, and casinos) and bank branches, disrupting coins available for payments.
- During the pandemic, many toll roads substituted cashMoney in physical form such as banknotes and coins. More with digital paymentA transfer of funds which discharges an obligation on the part of a payer vis-à-vis a payee. More methods (including EZ Pass).
- The use of credit, debit and payment cards also increased at laundromats and casinos.
- Most banks have stopped accepting loose coin deposits and have removed coin-counting machines from their branches.
The Demand Side
“The weak coin circulation affects most everyone, but the hardest hit are small cash-dependent businesses and those who are least well off. For millions of Americans, cash is the only form of payment.” – Hannah L. Walker, U.S. Coin Task Force member and Vice President with FMI – The Food Industry Association.
At the same time, the transactional demand for coins remained stable.
- The use of cash did not decline among low-income and underbanked individuals, seniors, youth and single parents, working-class individuals, minorities and immigrants (see Figure 2). According to the World Bank’s Global Financial InclusionA process by which individuals and businesses can access appropriate, affordable, and timely financial products and services. These include banking, loan, equity, and insurance products. While it is recognised that not all individuals need or want financial services, the goal of financial inclusion is to remove all barriers, both supply side and demand side. Supply side barriers stem from financial institutions themselves. They often indicate poor financial infrastructure, and include lack of ne... More Database, 5% of Americans (age 15 and older) had no financial institution account in 2021.
- Self-checkout machines and cash checking at large retailers required higher transaction coin inventories.
Figure 2. United States: Groups Affected by the Coin Circulation Disruption, 2020-2022
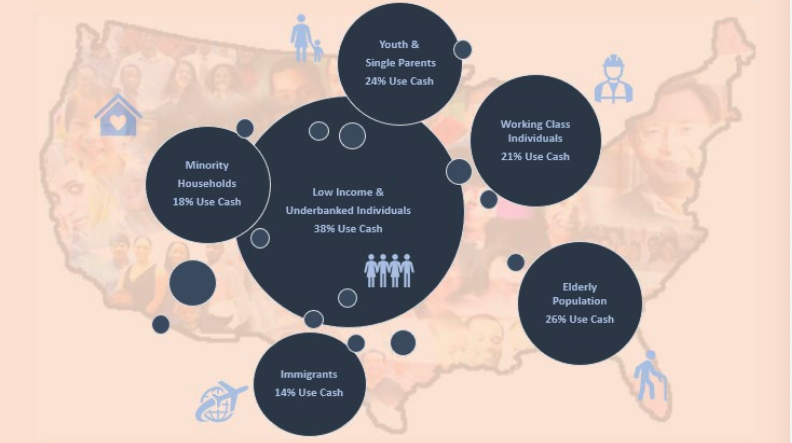
Source: U.S. Coin Task Force (2022: 20).
Bigger Coin Jars
U.S. consumers increased their coin holdings at home. The median household holds $60-$90 in coins. (U.S. Mint, Federal Reserve 2022: 13). A 2022 survey found that 40% of consumers placed coins received as changeThis is the action by which certain banknotes and/or coins are exchanged for the same amount in banknotes/coins of a different face value, or unit value. See Exchange. More in their piggy banks or coin jars; 33% held them in their wallets to use in payments, and 12% used them for tips (see Graph 4).
Graph 4. United States: Consumers’ Use of Coins Received as Change, 2022 (Percentages)

Source: U.S. Mint, Federal Reserve (2022: 13).
Challenges to Coin Circulation
“Until coin circulation patterns return to normal, it may be more difficult for retailers and small businesses to accept cash payments. For millions of Americans, cash is the only form of payment and cash transactions rely on coins to make change. […] The coin supply problem can be solved with each of us doing our part.” – U.S. Mint
To mitigate the disruption of coins circulation during the Covid-19 pandemic,
- The U.S. Mint increased its production of coins (see Graph 1).
- The U.S. Mint and Federal Reserve Banks released 5 billion pieces of coin reserves.
- The U.S. Coin Task Force, a group of coin industry representatives, launched the #GetCoinMoving campaign to encourage the public to spend their coins, deposit them at financial institutions, and redeem them at coin kiosks.
The U.S. Mint and the Federal Reserve (2022: 19-24) have advanced some proposals to solve the circulation challenge, including:
- Increased transparency by improving data on coin inventories, flows, and demand across the coin ecosystem.
- Inventory management by improving existing methodologies and practices to manage coin inventories.
- Denomination shifts, changing the U.S. Mint’s production from lower to higher-value coins.
- Reinforced consumer pathways by boosting consumer awareness and supporting options for depositing loose coins cheaply and conveniently.
The Cost and Public Support for Small Change
In the fiscal year 2022, the U.S. Mint faced costs of 2.72 cents to produce a 1-cent penny, and each 5-cent nickelMetal used in the manufacture of coins. More cost 10.41 cents (U.S. Mint 2022 Annual Report: 10, 12). The unit cost for pennies and nickels has remained above face valueThe figure or amount written on the banknote or coin which indicates the amount of its economic value. It is usually written in letters and numbers. More since the fiscal year 2005.
Data for Progress polling from August 2022 showed that 58% of U.S. voters agreed to stop producing new pennies, and 33% favored stopping new nickels production. Support to continue the production of new pennies and nickels reached 34% and 59%, respectively.
This post is also available in:
![]()