Banknote Developments at the Global Level: An Annual Update
This post is also available in:
![]()
Antti Heinonen is the Chairman of the BanknoteA banknote (or ‘bill’ as it is often referred to in the US) is a type of negotiable promissory note, issued by a bank or other licensed authority, payable to the bearer on demand. More Ethics Initiative and Former Director, Banknotes of the European Central Bank.
This article was first published in CurrencyThe money used in a particular country at a particular time, like dollar, yen, euro, etc., consisting of banknotes and coins, that does not require endorsement as a medium of exchange. More News Volume 17 – n° 9 September 2019. It is republished with the permission of the author.
In this rapidly changing and uncertain environment, it is crucial more than ever to follow banknote developments not only at the national but also at the global level. Even if we do not know what the future will hold, we should be at least aware where we are. This is the background for this update on banknote developments at the global level, in its third year (see CN September 2017 and 2018). The environment of continuously evolving new paymentA transfer of funds which discharges an obligation on the part of a payer vis-à-vis a payee. More methods is also a wake-up call to all central banks to make the relevant information available to allow more comprehensive studies.
Central bank websites have been the main source of information, and using statistics and various publications available, altogether 141 currencies have been addressed. These include all but seven currencies where the respective central bank either does not have a website or it does not include any relevant up-to-date information.
When addressing banknote demand globally, the most widely publicly available information is the value of banknotes in circulation. Again, to have as full review as possible it was necessary to use slightly different concepts. Besides ‘banknotes in circulation’, the only available figure in some cases was ‘banknotes and coins in circulation’ or ‘currency outside banks’. The latter concept is normally published as part of the monetary base, a monetary aggregate important to monetary policy. Its use in this study was, however, limited to less than 10% of the currencies.
These conceptual differences create only a very minor problem, because coins are generally just a few percentages of the total cash in circulationThe value (or number of units) of the banknotes and coins in circulation within an economy. Cash in circulation is included in the M1 monetary aggregate and comprises only the banknotes and coins in circulation outside the Monetary Financial Institutions (MFI), as stated in the consolidated balance sheet of the MFIs, which means that the cash issued and held by the MFIs has been subtracted (“cash reserves”). Cash in circulation does not include the balance of the central bank’s own banknot... More figure. Similarly, not including the banks ́ vaultSafe; strong room. A place reinforced with special security measures where high-value objects and documents are safeguarded. In central banks, banknotes and other objects are safeguarded in vaults. More cashMoney in physical form such as banknotes and coins. More does not normally have any significant impact on the calculation of the annual growth rate of banknote circulation.
For the banknote community, a more interesting pieceIn plural, it is commonly used as synonym for units of banknotes and coins. More of information is the growth rate of the number of banknotes, or the volume, in circulation. The volume in circulation has more impact than the value on the production, processing or logisticsThe term originates from military language and refers to the movement and provisioning of troops at war. In today’s business vocabulary, it refers to the management in particular, the transportation, storage and distribution of finished goods. More of banknotes, other things being equal. It also better accounts for inflationary effects, which are mirrored in the value of banknotes in circulation.
With the kind support of a few central bank colleagues, the banknote volume information was available from close to two thirds of the currencies. In addition, for the first time when doing this exercise, the information was available from all currencies except one from the preceding year, allowing a better comparison.
Although this is a good progress, still one third of the central banks are silent on the banknote volumes in circulation, not to speak of banknote production or processing as regards their publicly available information. A number of these central banks have, however, a lot of statistical information on their websites on non-cash payment instruments, issued by the private sector. It seems odd that similar and even more extensive information is not provided on their own product, banknotes.
This time the update will be limited to these two variables. In the two earlier surveys, banknote counterfeiting was addressed. Last year the publicly available information on counterfeiting was extended with the responses to a questionnaire submitted by the participants of the ECB Central Bank Banknote Seminar in 2018.
This time similar information was not available, and given that the majority of central banks are very shy on public information on counterfeiting, this has been excluded from this year’s update.
Banknote circulation in value terms
Then to the results, which refer in most cases to the end of 2018 (in some cases the financial year is not the calendar year and the figures may refer to the end of the financial year). For comparative purposes the same information from the year 2017 is included in the graph.
With the caveats mentioned earlier, the annual growth rates of the value of banknotes in circulation are described in the Figure 1, including information on 141 currencies (142 currencies in 2017).

The first observation is that the distribution is more centred and there is slight movement to the left. This is also reflected in the median annual growth rate, which is 7.1% in 2018 in comparison to 8.1% and 8.3% in 2017 and 2016 respectively. Apart from this decrease in the median growth rate, three kinds of different groups and developments can be identified in general terms on the basis of Figure 1.
In the case of more than 30% (35% in 2017) of the currencies, the demand for banknotes in value terms is growing rapidly (double digit). Examples of currencies in this group can be found across all continents. Typically, the development in this group is driven by economic and population growth, and citizens having increased access to banking services. In some cases the rapid value growth of banknotes in circulation is connected to high inflation.
The Indian rupee is one of the currencies belonging to this first group, having rapidly growing demand. For recollection, following the country’s demonetisationSee Demonetised banknote. More programme, the value of Indian rupee banknotes in circulation was 20% lower in March 2O17 than at the end of the preceding financial year. ln March 2018 its level had surpassed the pre-demonetisation level with 10% (annual increase 38%). More recently the rapid growth of the value of banknotes in circulation has continued, the annual increase being 17% in March 2019.
The second group includes the currencies of most of the developed economies, in which the demand for banknotes is still increasing but by a single digit growth rate. This group includes the majority, almost 60% of the currencies. This second group includes also Chinese renminbi banknotes irrespective of the recent annual increases of several tens of per cents in the use of mobile payments. Also British pound banknotes belong to this group, with a small annual increase (1.4 %) at the end of February 2019, the annual growth levelling off in the preceding financial year after several years of more than 5% annual growth rates.
The third group consists of 13 currencies (11 in 2017) where the demand for banknotes decreased in 2018 on an annual basis. In the case of three of the currencies – namely, the Brunei dollarMonetary unit of the United States of America, and a number of other countries e.g. Australia, Canada and New Zealand. More, Norwegian krone and Omani rial – this was at least the second consecutive year with a decrease. Surprisingly, the Swedish krona was not in this group given its continuous annual decreases between 2008 and 2017, and a 36% decline during the five years by 2017.
In Norway, access to cash has diminished, and the value of krone banknotes in circulation has decreased 13.7 % from the end of 2015 after having been quite stable during several preceding years.
The value of Brunei dollar banknotes in circulation has decreased 10.2 % during the last two years, and with the goal to reduce cash and check usage, Brunei Darussalam envisages becoming a Digital Payment Nation by 2025¹.
Oman does not seem to have equally ambitious goal. However, the decrease in the value of rial banknotes in circulation has been 10.4% since the end of 2015 irrespective of strong nominal GDP growth during the last two years.
Banknote circulation in volume terms
After thorough work, the more interesting indicator on banknote developments, the growth in the number of banknotes in circulation or the growth of banknote volumes, was available from 92 currencies. Figure 2 addresses the distribution of these 92 currencies regarding the growth rates in banknote volumes.

Evidently, the Figures 1 and 2 are not fully comparable, because the sample on which Figure 2 is based is about 50 currencies fewer. However, a few interesting conclusions can be drawn on the basis of these figures.
First, the distributions are similar, the majority of the currencies having a single digit growth rate also in volume terms. The median annual volume growth of these 92 currencies was 4.7% in 2018 (the median
of 65 currencies in 2017 was 6.4%). This difference between the growth rates of the value and volume of banknotes in circulation is in line with expectations, with growing banknote demand being partly explained by the store of valueOne of the functions of money or more generally of any asset that can be saved and exchanged at a later time without loss of its purchasing power. See also Precautionary Holdings. More function of banknotes, for which the higher denominations are used. This issue will be addressed further below; however, already now it can be concluded that not only the value of banknotes in circulation is increasing at the global level but also their volume.
There are ten currencies which had a negative banknote volume growth in 2018. Somewhat surprisingly, only one, the Norwegian krone, had negative annual growth rates in both value and volume terms. All the other nine currencies with negative annual volume growth had a positive annual growth in value terms. This means that, in the case of these currencies, the share of higher denominations had increased at the expense of lower denominations.
It is also interesting to compare the annual volume and value growths in these 92 currencies. In this respect the currencies are divided in Figure 3 in three groups: 1) the annual volume and value growth rates are within narrow range (15%) (called the ‘same’), 2) the annual banknote volume growth is at least 15% lower than the value growth, and 3) the volume growth is at least 15% higher than the value growth.
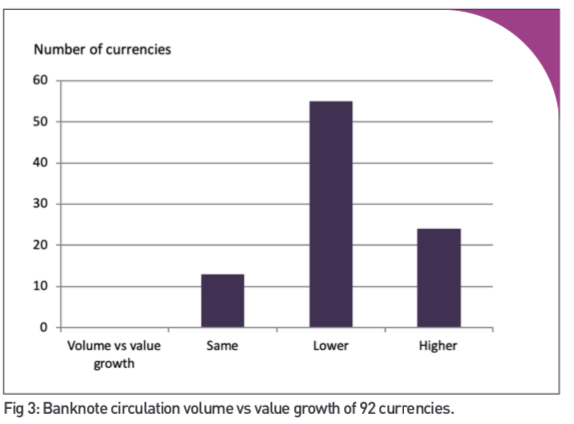
On the basis of Figure 3, the great majority of these 92 currencies have a significantly lower volume growth than value growth. This is in line with the provisional indication above, that the role of the store of value function of banknotes has increased simultaneously when the share, but not necessarily the volume, of banknote transactions has decreased.
Interestingly, some of the major currencies like the British pound, Chinese renminbi, euroThe name of the European single currency adopted by the European Council at the meeting held in Madrid on 15-16 December 1995. See ECU. More and Swiss franc, do not belong to this majority group. All of them had in 2018 a higher volume than value growth of banknotes in circulation. Most of them are used also as a store of value outside their borders, which could have implied that the volume growth is lower than that of the value. The explanations why it is not so may differ in the case of the various currencies.
Conclusions
In general terms, three kinds of developments in value of banknote circulation can be identified:
1. Currencies, mainly in the developing world, with demand growing at a double digit pace;
2. Currencies of most developed economies, in particular, in which demand is increasing by a single digit growth rate, and;
3. Less than 10% of the currencies showing declining annual value growth in 2018.
However, only three currencies have at least two consecutive years of decline, and only one of the currencies with a negative value growth has also a negative volume growth.
As regards banknote volumes in circulation, they are in general growing slower than the values. This points to the increasing role of the store of value function of banknotes, albeit there are also interesting exceptions to this development among the major currencies.
In an environment of continuously evolving new payment methods and habits, it is indispensable for the banknote community to follow the developments of various banknote indicators not only at the national but also at the global level. The figures do not necessarily tell anything about the future, but they will show the rate of changeThis is the action by which certain banknotes and/or coins are exchanged for the same amount in banknotes/coins of a different face value, or unit value. See Exchange. More, and can provide interesting comparisons between countries as the recent comparative study between Canada and Sweden does². Therefore, central bank cash managers should consider how to improve the availability of cash related data on their websites.
The central bank website is the natural channel to provide information to various target groups. To be most up-to-date, the information could be in the statistics section of the website, or at least in the regular publications like annual or quarterly reports. Besides the value and volume of banknotes in circulation, it would be interesting to follow also the development of production volumes, new note issuance, processing and destruction of banknotesA process by which a central bank destroys banknotes that are unfit to return into the fiduciary circulation. This is the last step in the life of the banknote. The destruction can be done manually or mechanically, and the latter may be online or offline. Online destruction is directly performed by automated sorting machines, without interruption of the treatment process. The process needs to be controlled in a very special way, since there is no possibility of verification or reconciliation. More at the global level.
All this information is gathered at the central banks, and the question is only to find an appropriate way to provide it publicly. Several central banks are already doing it. Hopefully, additional central banks will understand the importance of publicly available information on currency developments during these interesting times. That would make this kind of study even more informative.
Transparency would also help the currency management function better, and transparency goes hand in hand with trust.
¹ Autoriti Monetari Brunei Darussalam Annual Report 2018 p. 14.
² A Tale of Two Countries: Cash Demand in Canada and Sweden, Bank of Canada, Staff Discussion PaperSee Banknote paper. More 2019-7 by Walter Engert, Ben Fung and Björn Segendorf, August 2019.
This post is also available in:
![]()