ECB: Cash Use Across Euro-Area Countries
The European Central Bank (ECB) published its latest Study on the PaymentA transfer of funds which discharges an obligation on the part of a payer vis-à-vis a payee. More Attitudes of Consumers in the EuroThe name of the European single currency adopted by the European Council at the meeting held in Madrid on 15-16 December 1995. See ECU. More Area (SPACE) in December 2022. CashEssentials published a summary of SPACE 2022 findings for the euro area here. This article explores cross-country differences within the European Union.
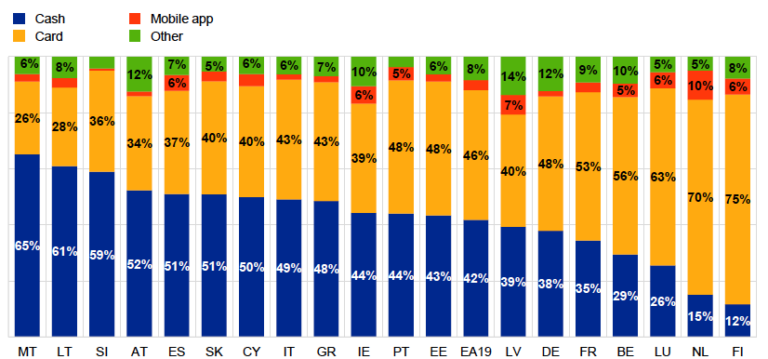
Point-of-Sale (POSAbbreviation for “point of sale”. See Point-of-Sale terminal. More) Transactions
- As Graph 1 shows, cashMoney in physical form such as banknotes and coins. More prevailed at point-of-sale (POS) transactions in Malta (77%), Slovenia (73%), Austria (70%), and Italy (69%).
- By value, cash prevailed in POS payments in Malta (65%), Lithuania (61%), and Slovenia (59%).
- Respondents paid with cards most often in Finland (reaching 70% of POS transactions), the Netherlands (67%), Luxembourg (52%), and Belgium (48%).
Graph 1. Euro Area: Share of Payment Instruments in Point-of-Sale (POS) Transactions, 2022
1. By Number of Transactions 2. By Value of Transactions
 Source: ECB (2022: 19).
Person-to-Person (P2P) Payments
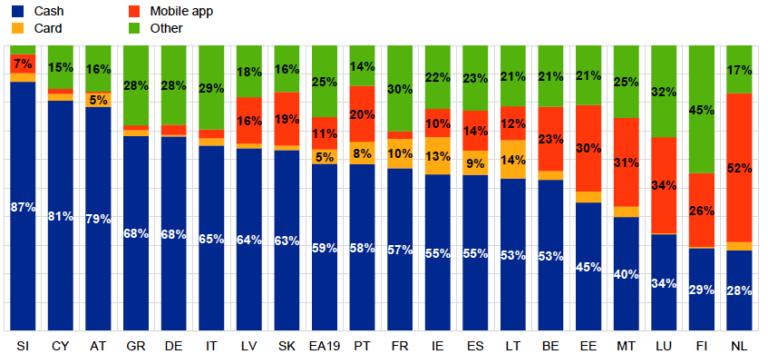
- Over 80% of person-to-person (P2P) payments in Germany, Cyprus, Slovenia, Greece, Italy, and Austria were made in cash (see Graph 2). Cash represented less than 50% of P2P transactions in the Netherlands, Finland, Estonia, and Luxembourg.
- The Netherlands had the highest share (43%) of mobile phone apps in P2P payments.
- By value, cash prevailed in P2P payments in Slovenia, Cyprus, Austria, Greece, and Germany; it had the lowest shares of P2P payments in the Netherlands, Finland, Luxembourg, and Malta.
Graph 2. Euro Area: Share of Payment Instruments used for P2P Payments, 2022
Source: ECB (2022: 26).
Cash Use
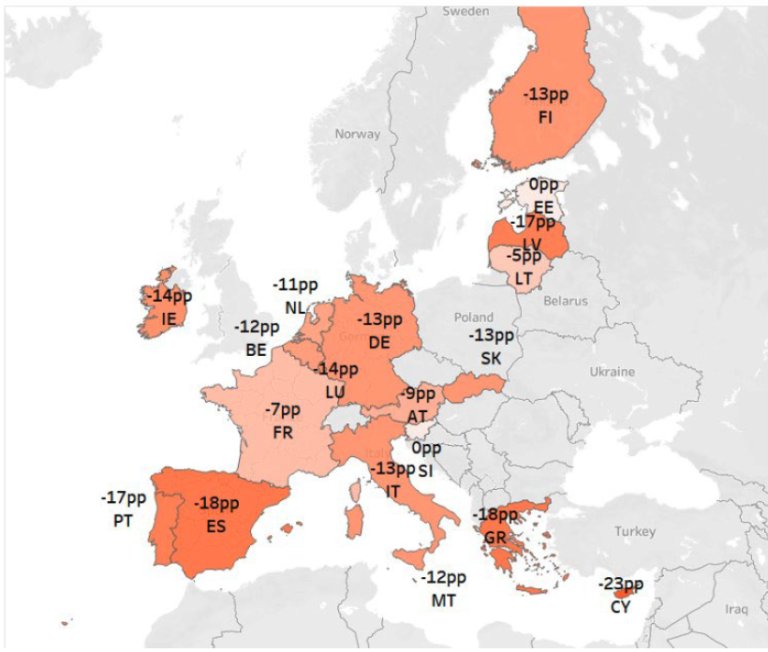
The use of cash declined in the euro area in 2022 compared with 2019 (see Map 1).
- The decline (measured in transactions volume) was biggest in Greece (-18%), Spain (-18%), Cyprus (-23%), and Portugal (17%).
- Cash use remained nearly the same in Slovenia and Estonia.
- By value, cash declined the most in Cyprus (-23%), Latvia (-19%), Spain (-14%), and Slovakia (-12%)
Map 1. Euro Area: ChangeThis is the action by which certain banknotes and/or coins are exchanged for the same amount in banknotes/coins of a different face value, or unit value. See Exchange. More in the Share of Cash Use in POS Transaction, 2019-2022
Source: ECB (2022: 20-21).
Cash Holdings
On average, people in the euro area had €83 in their wallets in 2022. Respondents in Austria, Luxemburg, Cyprus, Lithuania, Ireland, and Estonia reported having cash holdings of over €100 (see Graph 3). Respondents in the Netherlands (€46), Portugal (€53), and France (€61) had the lowest cash holdings.
Graph 3. Euro Area: Average Amount of Cash in Wallet at the Beginning of the Day, 2022 Source: ECB (2022: 45).
Regarding the precautionary demand for cash, people in the euro area kept higher cash reserves in 2022 (37%) compared to 2019 (34%) due to the Covid-19 pandemic, economic uncertainty, and consumers’ budgeting practices.
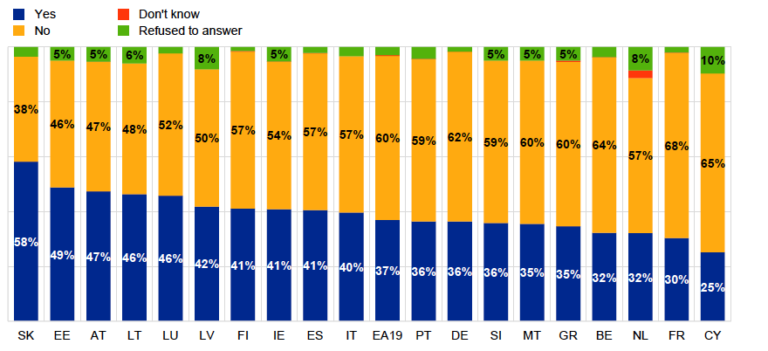
- Slovakia (58%) and Estonia (49%) had the highest shares of people keeping extra cash reserves (see Graph 4).
- France (30%) and Cyprus (25%) had the lowest percentages.
Graph 4. Euro Area: Share of Consumers Keeping Extra Cash Reserves, 2022
Source: ECB (2022: 46).
While most people (85%) in the euro area received no share of regular income in cash in 2022, 6-7% of people in Latvia, Italy, Austria, Spain, Slovakia, and Ireland reported receiving up to a quarter of their income in cash; that figure increased to 11% in Greece (see Graph 5).
Graph 5. Euro Area: Share of Regular Income Received in Cash, 2022

Source: ECB (2022: 46).
Access to Cash
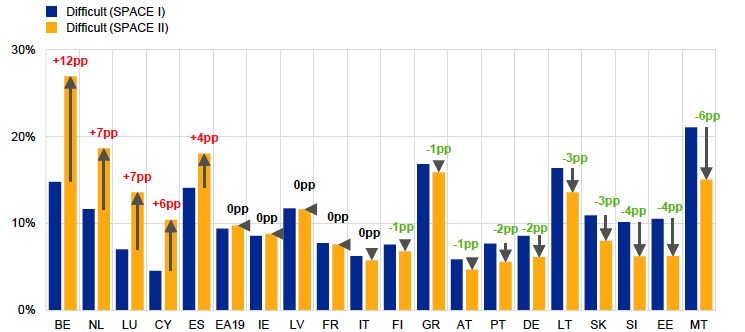
As Graph 6 shows, obtaining cash from ATMs worsened the most between 2019 and 2022 in Belgium (12%), the Netherlands (7%), Luxemburg (7%), Cyprus (6%), and Spain (4%). The share of respondents perceiving access to cash withdrawals to be difficult decreased the most in Malta (6%), Estonia (4%), and Slovenia (4%).
Graph 6. Euro Area: Share of Respondents Perceiving Access to Cash Withdrawals to Be Fairly or Very Difficult, 2022
Source: ECB (2022: 49).
The highest shares of respondents preferring to obtain cash by the source of withdrawals (Graph 7) were
- ATMs: Cyprus (89%), Portugal (86%), Spain (82%), and Finland (81%).
- Bank counters: Belgium (13%), Ireland (10%), France (9%), and Malta (8%).
- Cash reserves: Germany (30%), Malta (25%), and Slovakia (17%).
- CashbackA service whereby the customer pays electronically a higher amount to a retailer than the value of the purchase for goods and/or services and receives the difference in cash. It is also a reward system associated with credit card usage, whereby the consumer receives a percentage of the amount spent on the credit card. More: Ireland (10%), Luxemburg (8%), and Belgium (7%).
- Cash in shop: the Netherlands (20%).
Graph 7. Euro Area: Sources of Cash Withdrawals, 2022

Source: ECB (2022: 50).
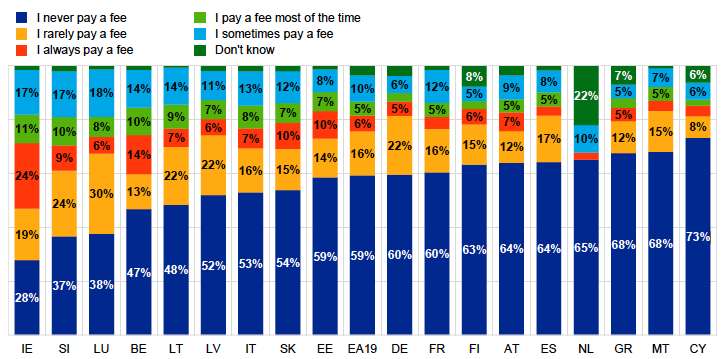
While fees for cash withdrawals vary across countries (see Graph 8), significant shares of respondents in Ireland (24%), Belgium (14%), Slovakia (10%), Estonia (10%), and Slovenia (9%) reported they always paid a fee when withdrawing cash, pointing to problems in the access of cash.
Graph 8. Euro Area: Share of Respondents Likely to Pay Fees for Cash Withdrawals, 2022
Source: ECB (2022: 50).
Payment Preferences
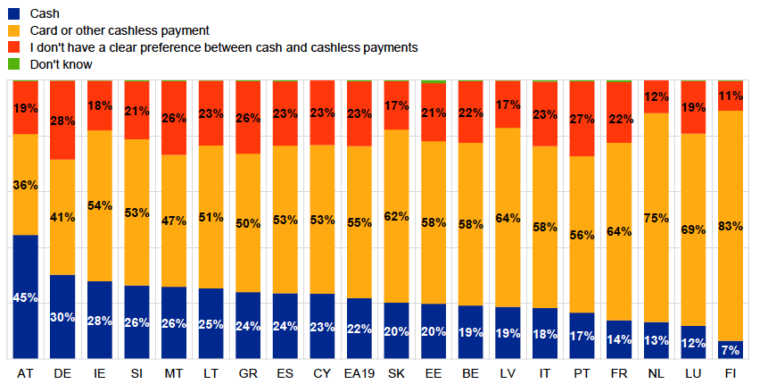
Across the euro area, 22% of respondents preferred paying with cash in 2022, down from 27% in 2019. By country (Graph 9):
- Preference for cash was higher in Austria (45%), Germany (30%), Ireland (28%), and Slovenia (26%).
- Less than 15% of Finland, Luxembourg, the Netherlands, and France respondents reported cash as their preferred payment instrumentDevice, tool, procedure or system used to make a transaction or settle a debt. More.
- Germany (28%), Portugal (27%), Greece, and Malta (26% each) had the most people who were indifferent between using cash and cashless payments.
Graph 9. Euro Area: Preferred Payment Instrument by Country, 2022
Source: ECB (2022: 41).
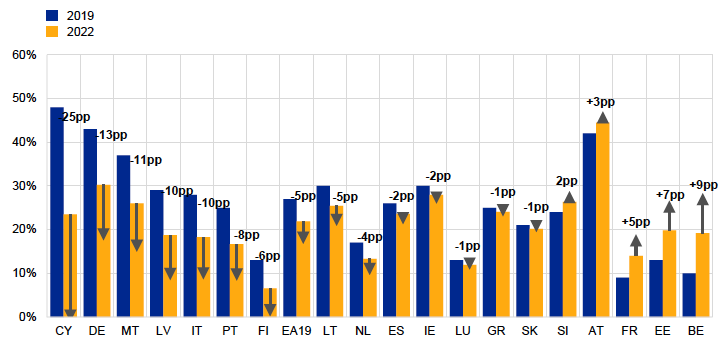
The preference for cash between 2019 and 2022 (Graph 10) increased the most in Belgium (9%), Estonia (7%), France (5%), and Austria (3%). It declined the most in Cyprus (-25%), Germany (-13%), Malta (-11%), Latvia, and Italy (both with -10%).
Graph 10. Euro Area: Preferences for Cash, 2019-2022
Source: ECB (2022: 41).
Payment Choice
Most people (60%) in the euro area consider having the option to pay with cash very or fairly important (Graph 11). Support was more robust in Germany (69%), Greece (69%), and Austria (66%). Having a cash option was also crucial for pluralities in Slovakia (46%), the Netherlands (46%), and Estonia (47%).
Graph 11. Euro Area: Importance of Having Cash as a Payment Option, 2022

Source: ECB (2022: 39).
This post is also available in:
![]()

